API for viewing the frame #15
Comments
|
Indeed, many people will want to make 'dataframe viewers', we just saw a new one recently: If the exchange API is good, this would work with any dataframe (i.e. the dataframe libraries don't have to include it) |
|
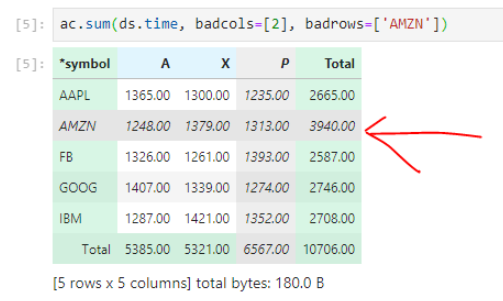
Sure.. when repr_html is called there should be a list of options on how to display the table. Here is one in HTML that we do... Notice how badrows or badcols (in this example) might be color marked for the user pick up easier.
Here is one in ANSI colored text
To me, how the data is displayed is left to another module/class. But then how does a user tag a column as "red" or make the header "bold". I can write more on this. |

|
Viewing the dataframe is a form of visualization. This is an important topic but should be handled at the same time as visualization, which should probably be later. |
|
Yeah, my assumption is that |
Interactive users will want to control how the data is displayed. This might include sorting the view; coloring cells, columns, or rows; precision digits; or moving columns to the left. It may also interact with auto complete.
It is common practice to separate the view from the data (many applications can display data in a SQL database in different ways).
I believe that we need to define an interface to the display data class (for instance, an ordered dictionary of strings containing arrays is the simplest interface. additional kwargs might include display attributes for rows or columns, there might be header or footer information).
Thus, believe it is in scope to define an interface so that multiple developers can write their own display data class. Almost every demonstration needs a way to display large amount of data well.
The text was updated successfully, but these errors were encountered: