


A tidybayes-inspired data layer for declarative Bayesian visualisation in Python
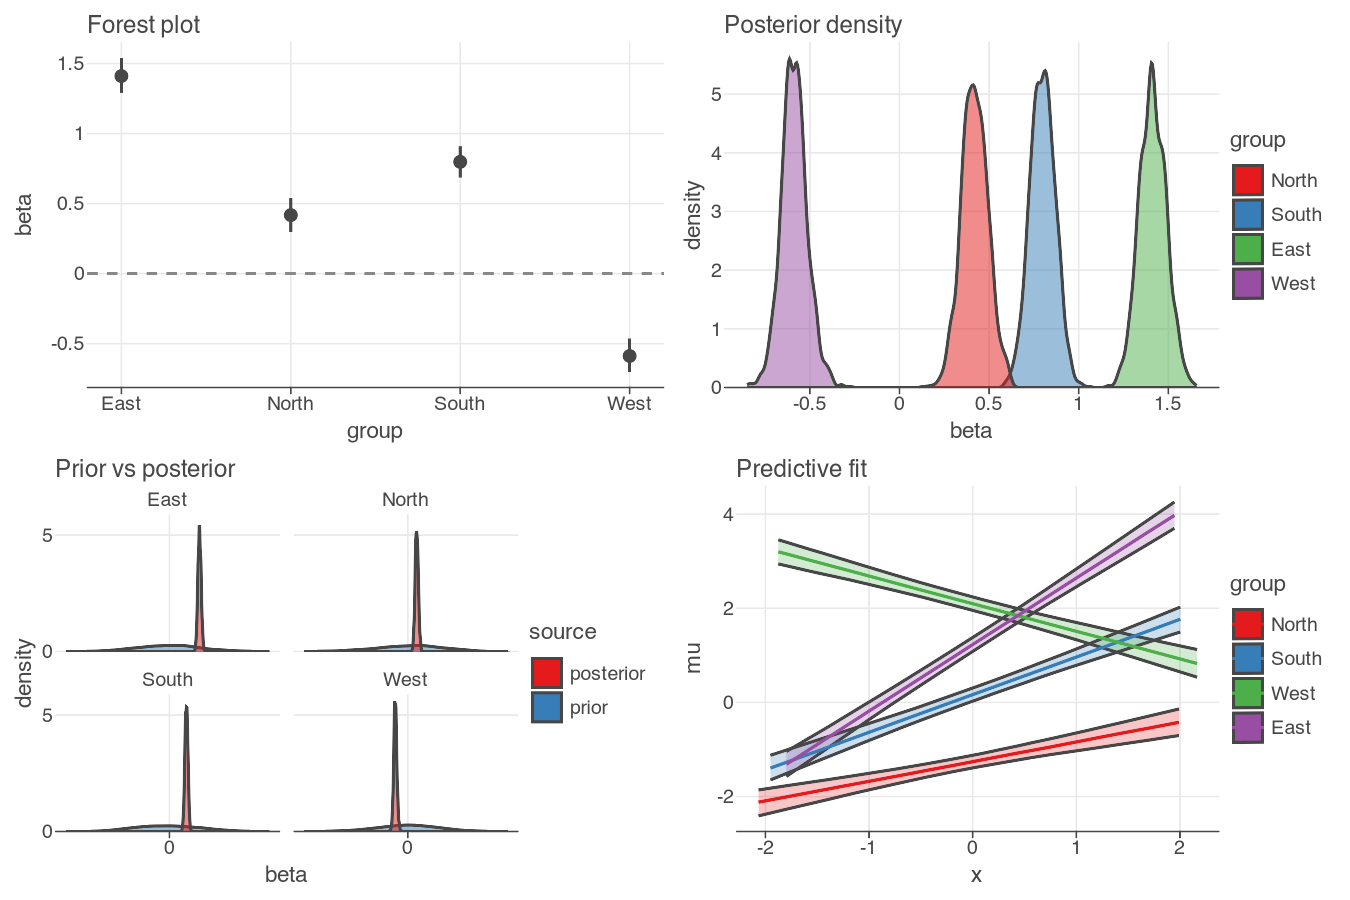
tidydraws turns MCMC output (ArviZ) into tidy Polars frames that are ready to plot — one .to_pandas() away from any ggplot-like backend. It does no plotting itself. Three functions, three spaces:
| Function | Space | Plot archetype |
|---|---|---|
parameter_draws() |
parameter | density, forest, scatter |
prediction_draws() |
prediction | ribbon + line, fit + data |
compare_draws() |
comparison | prior vs posterior, intervals |
With uv:
uv add tidydrawsWith pip:
pip install tidydrawsIf you want the latest functionality merged into main but not yet released, install directly from GitHub:
pip install git+https://github.com/drbenvincent/tidydraws.gitOr with uv:
uv add git+https://github.com/drbenvincent/tidydraws.gitPlotting MCMC output in Python means manually slicing xarray dimensions, iterating groups, and aligning coordinates — imperative, verbose, error-prone. R's tidybayes solved this with a data layer that respects parameter space vs prediction space. tidydraws brings that to Python on Polars.
Backend-agnostic:
tidydrawsreturns PolarsDataFrames. Call.to_pandas()to bridge to lets-plot, plotnine, or any library that takes pandas. See the examples for both lets-plot and plotnine versions.
Inspired by tidybayes for R.