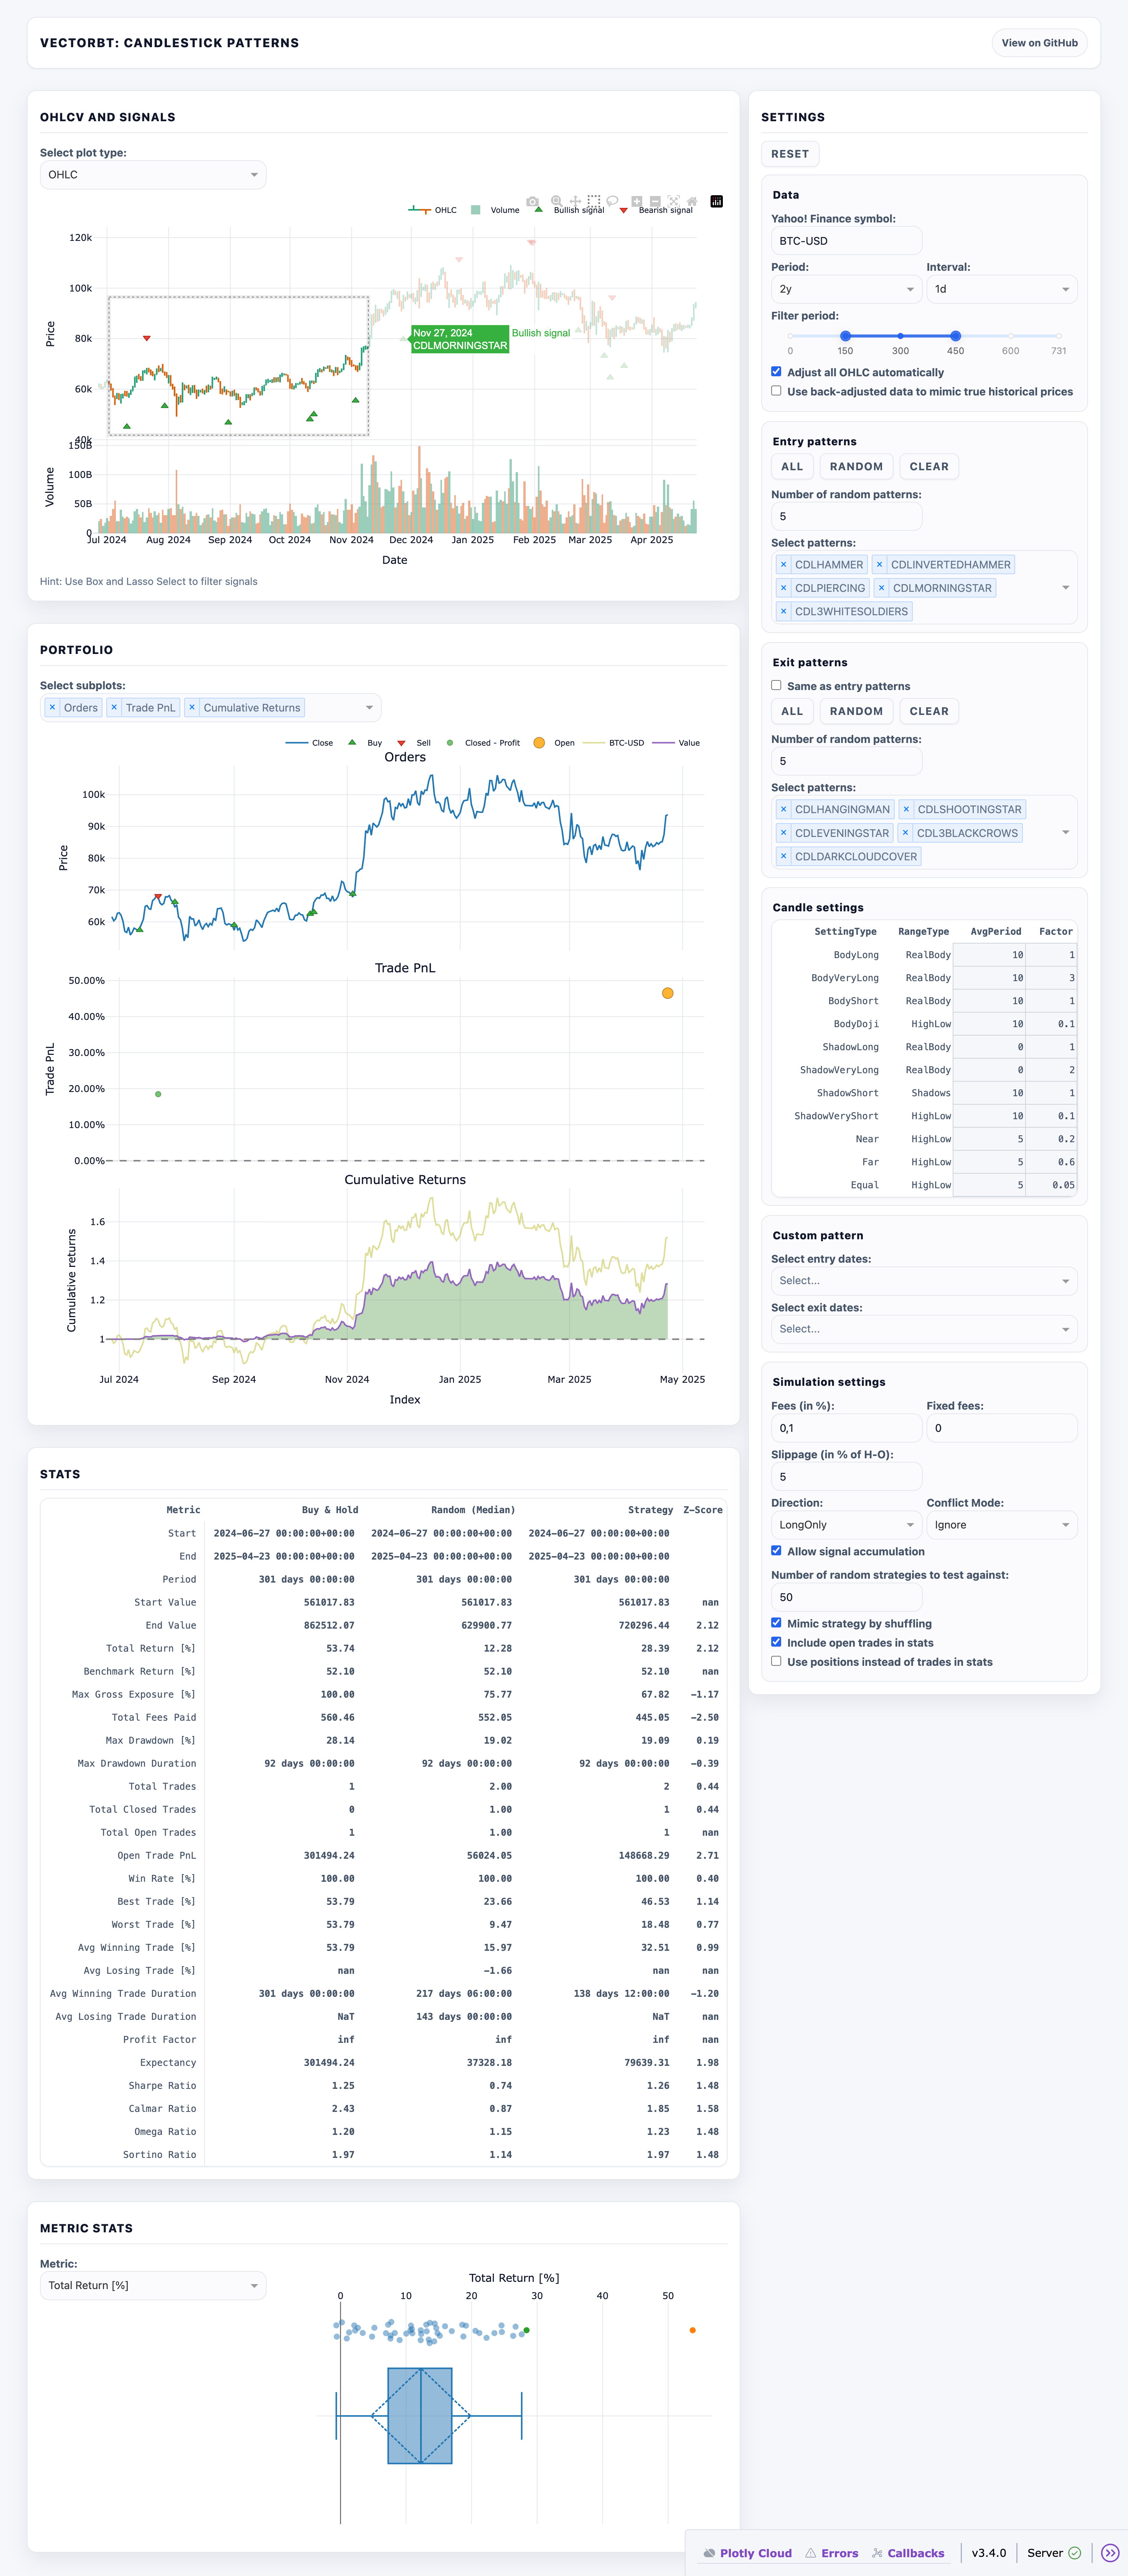
A Dash app to visualize and backtest candlestick patterns.
- Fetches market data via yfinance
- Detects candlestick patterns via TA-Lib
- Choose entry/exit patterns, override candle settings, or specify signals manually
- Backtests signals using VectorBT
- Visualizes OHLCV, signals, orders, trades, and portfolio value with Plotly
- Displays key performance metrics (e.g., Sharpe ratio)
- Compares strategy vs buy & hold and random trading
- Responsive UI with Dash Bootstrap Components
uv is a fast, modern replacement for pip + venv workflows.
git clone https://github.com/polakowo/vectorbt.git
cd vectorbt/apps/candlestick-patternsuv venv
uv pip install -r requirements.txtuv run python app.pyThen open: http://127.0.0.1:8050/
Tip
If you prefer activating the venv instead of using uv run, you can do:
- macOS/Linux:
source .venv/bin/activate - Windows (PowerShell):
.venv\Scripts\activate
Then run python app.py.
Build and run:
docker build -t candlestick-patterns .
docker run -p 8050:8050 -e HOST='0.0.0.0' candlestick-patterns
Open: http://127.0.0.1:8050/
Note
The first run can take a while because of Numba JIT compilation.