Extrapolation when kmax not high enough is not really linear #61
Description
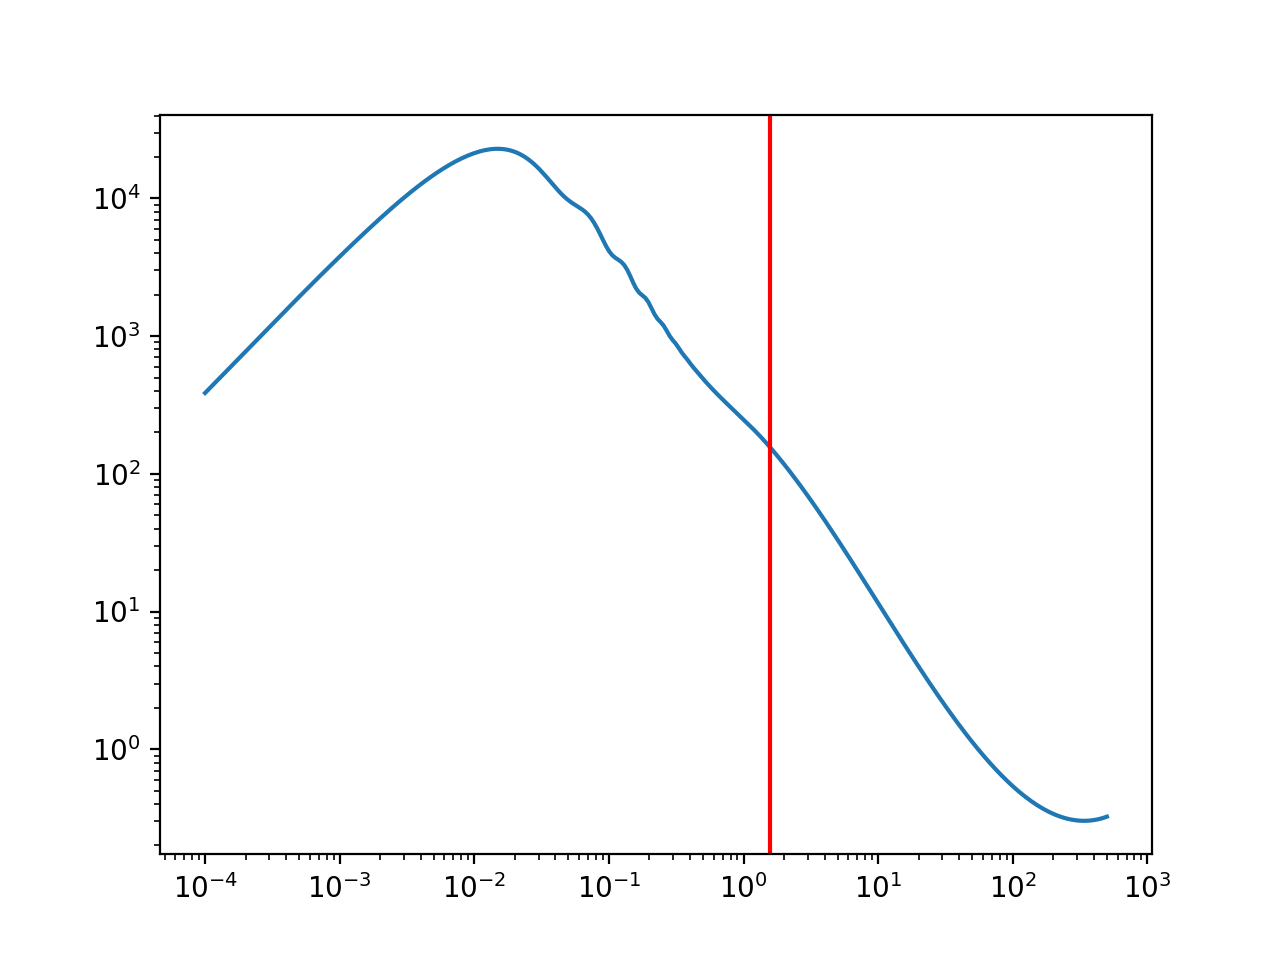
CMBdata.get_matter_power_interpolator shows slightly odd behaviour when extrapolating matter power to higher k, depending on the kmax value, in a way that doesn't match previous camb versions. This usually shows up in the NL power.
Because the extrapolation is cubic and the function only adds a single extrapolated point onto the end of the k array, you can end up with strange behaviour like up-ticks at high k.
See the code and figure below.
One solution would be to add a bunch more log-linearly extrapolated points to the array instead of just one.
Cheers,
Joe
import numpy as np
import matplotlib.pyplot as plt
import camb

# Example invocation from docs
cp = camb.set_params(ns=1, H0=67, ombh2=0.022, omch2=0.1, w=-0.95, Alens=1.2, lmax=2000,
                     WantTransfer=True, dark_energy_model='DarkEnergyPPF', kmax=1.0)

r = camb.get_results(cp)

P, z, k = r.get_matter_power_interpolator(nonlinear=True, return_z_k=True, extrap_kmax=500.)

k_plot = np.logspace(-4, np.log10(500), 300)
P_plot = P.P(0.0, k_plot)


plt.loglog(k_plot, P_plot)

# Maximum actual calculated value
plt.axvline(k.max(), color='r')

plt.show()