You signed in with another tab or window. Reload to refresh your session.You signed out in another tab or window. Reload to refresh your session.You switched accounts on another tab or window. Reload to refresh your session.Dismiss alert
This file contains hidden or bidirectional Unicode text that may be interpreted or compiled differently than what appears below. To review, open the file in an editor that reveals hidden Unicode characters.
Learn more about bidirectional Unicode characters
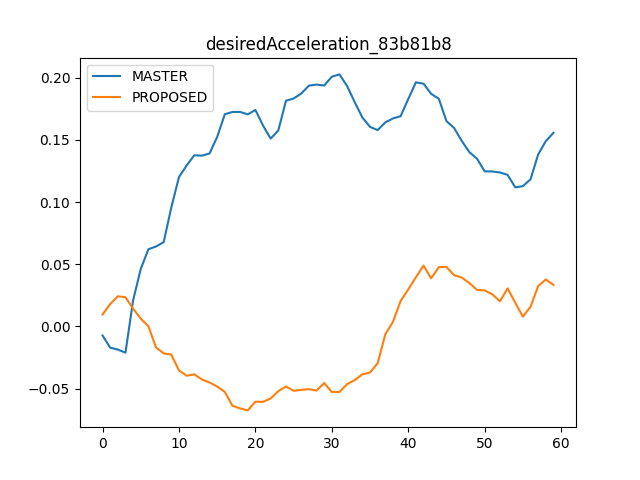
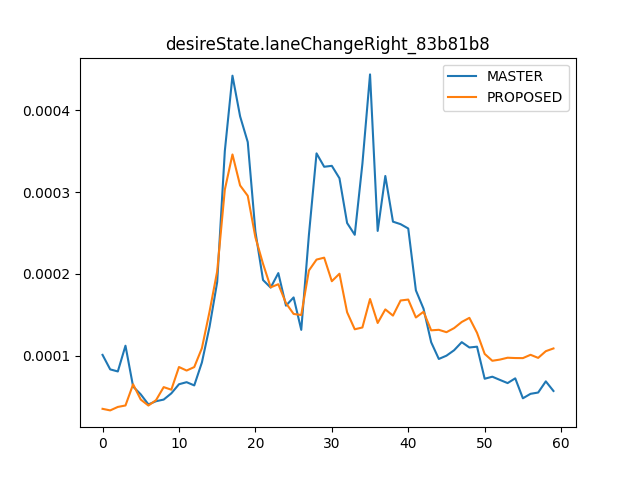
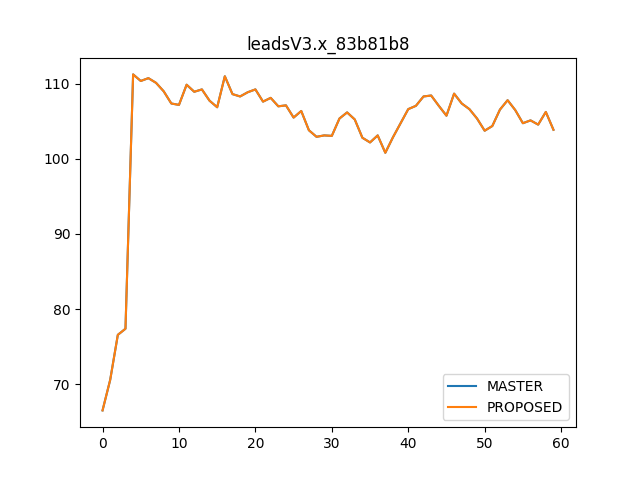
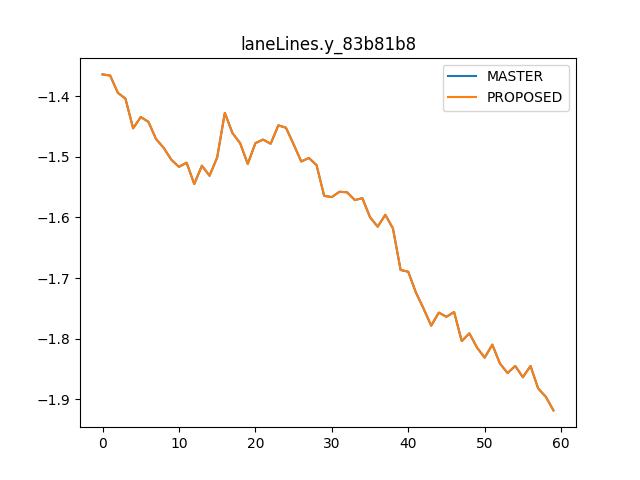
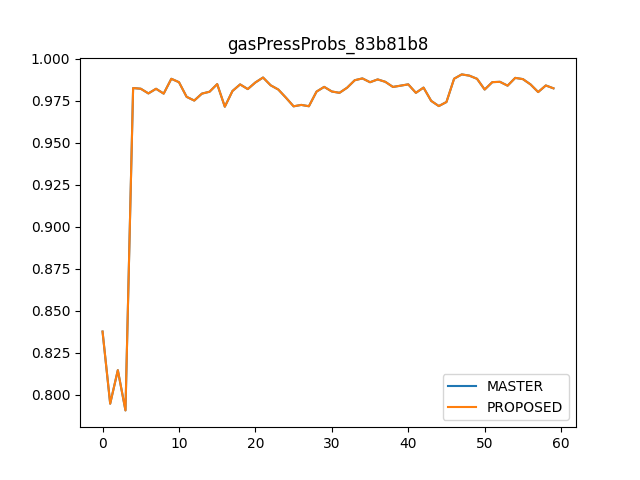
Are these plots for the experimental mode? I just tried out the experimental mode today, and the vehicle no longer accelerates on high ways, regardless of whether there is a vehicle in front of it or not. Setting the max speed to 65 mph when at 65 leads the vehicle to slow down over several minutes. The desired acceleration plot here could explain this new behavior.
Are these plots for the experimental mode? I just tried out the experimental mode today, and the vehicle no longer accelerates on high ways, regardless of whether there is a vehicle in front of it or not. Setting the max speed to 65 mph when at 65 leads the vehicle to slow down over several minutes. The desired acceleration plot here could explain this new behavior.
I will try the standard mode tomorrow.
Long time user (2020) and engineer.
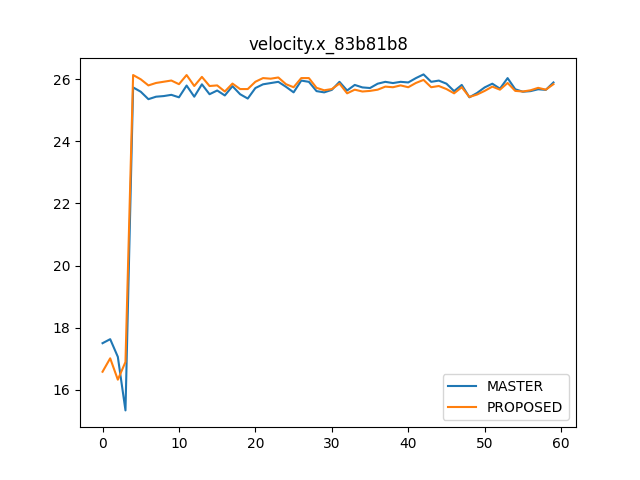
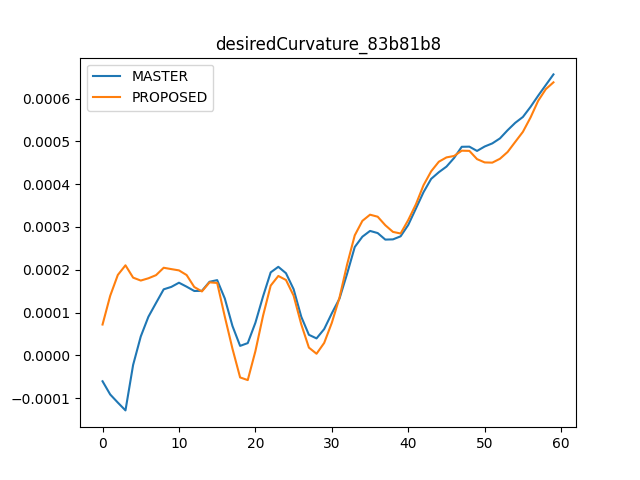
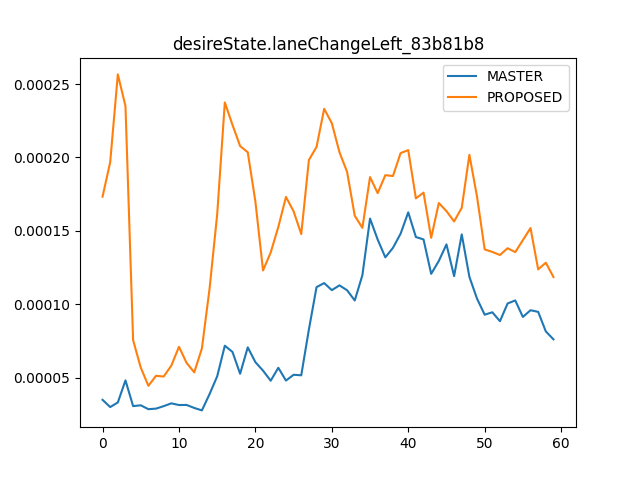
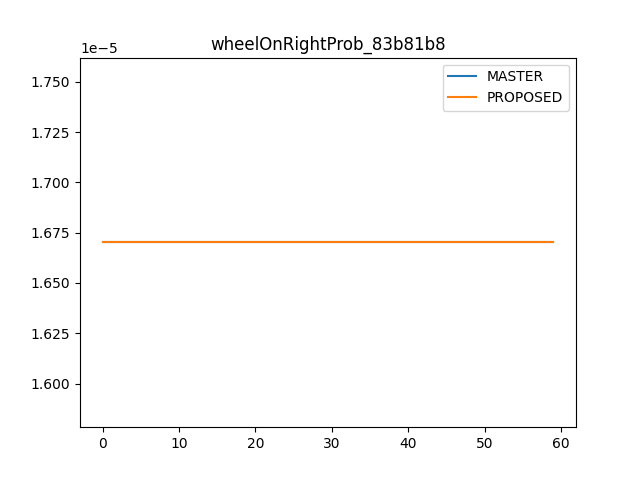
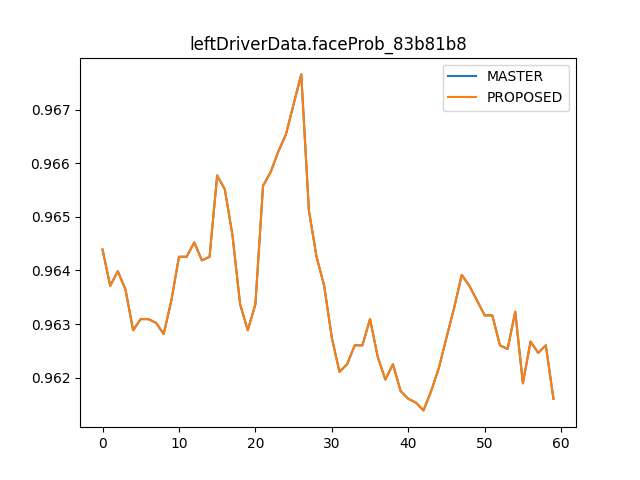
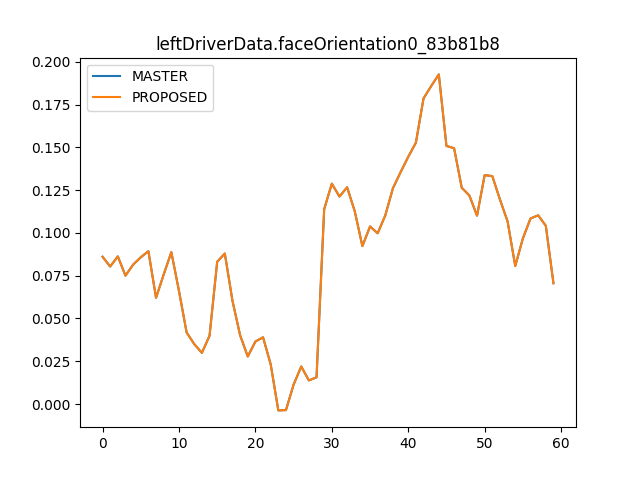
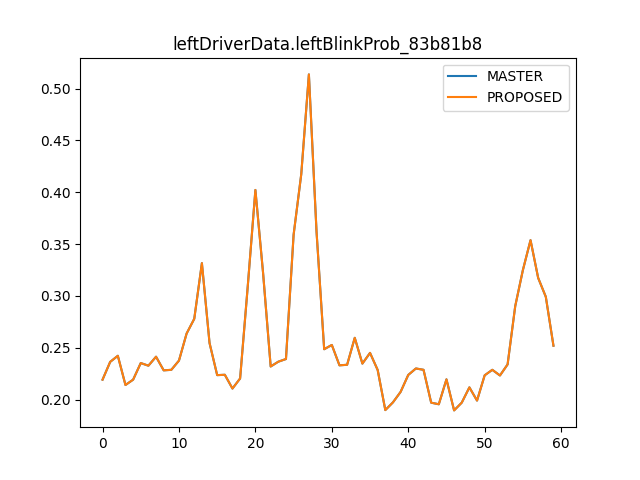
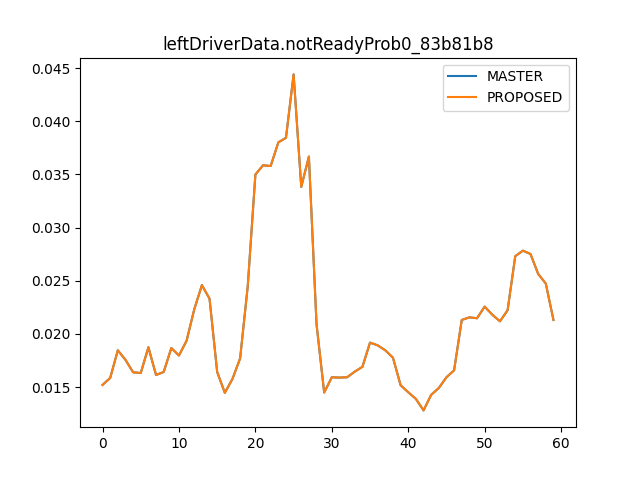
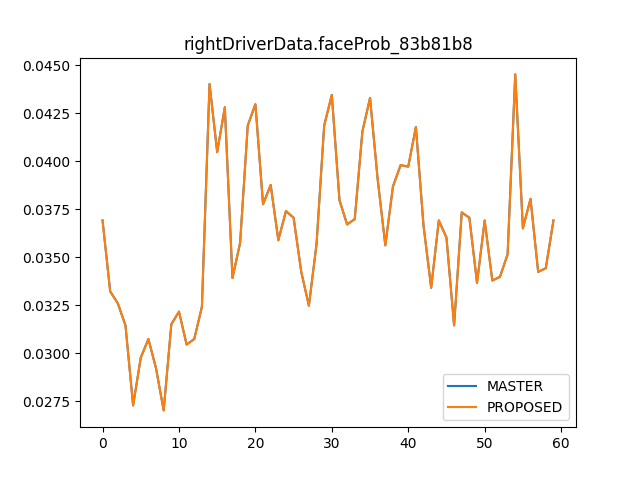
These plots are just sanity checks, not tests to verify model performance.
They just replay 60 frames from a test segment and pass them through the model.
Please send us a segment of your issues with experimental mode in the Feedback section of our discord.
Add this suggestion to a batch that can be applied as a single commit.This suggestion is invalid because no changes were made to the code.Suggestions cannot be applied while the pull request is closed.Suggestions cannot be applied while viewing a subset of changes.Only one suggestion per line can be applied in a batch.Add this suggestion to a batch that can be applied as a single commit.Applying suggestions on deleted lines is not supported.You must change the existing code in this line in order to create a valid suggestion.Outdated suggestions cannot be applied.This suggestion has been applied or marked resolved.Suggestions cannot be applied from pending reviews.Suggestions cannot be applied on multi-line comments.Suggestions cannot be applied while the pull request is queued to merge.Suggestion cannot be applied right now. Please check back later.
No description provided.