Describe the issue
When spinning up an .Net Core Application after an application pool recycle in IIS, the process seems to go on a few memory grabbing runs but doesn't appear to be using it - This doesn't look like a memory leak as the memory is always reclaimed.
For example, the memory usage will cycle upwards to around 3-4GB, back down to about 400mb, then up and down between these a handful more times before settling down to ~200mb. The application starts as normal through this process, and can be accessed and used as normal.
Normal usage averages at around 200mb.
We've managed to take a dump at it's peak;
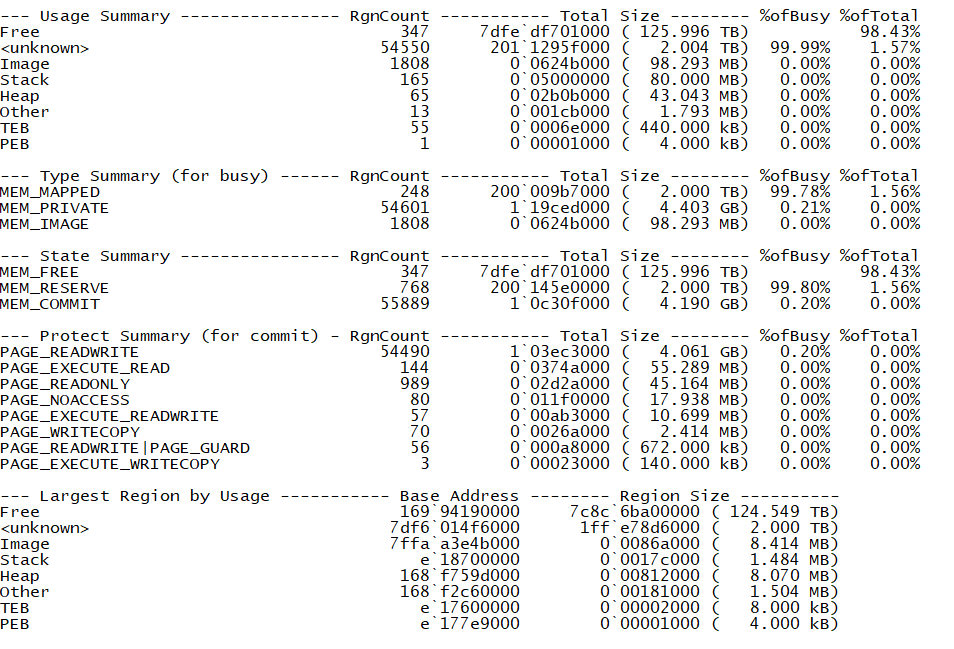
To Reproduce
- .Net Core 2.0
- .Net Core Runtime 2.0.7
- Windows Server 2016
- Workstation GC Mode
We haven't been able to reproduce this outside of our production server environments.
Is there a way we can determine what is causing this high memory usage during startup?
Edit
I've also been able to reproduce this with;
- .Net Core 2.2
- .Net Core Runtime 2.2.4
- Windows Server 2016
- Workstation GC Mode
Describe the issue
When spinning up an .Net Core Application after an application pool recycle in IIS, the process seems to go on a few memory grabbing runs but doesn't appear to be using it - This doesn't look like a memory leak as the memory is always reclaimed.
For example, the memory usage will cycle upwards to around 3-4GB, back down to about 400mb, then up and down between these a handful more times before settling down to ~200mb. The application starts as normal through this process, and can be accessed and used as normal.
Normal usage averages at around 200mb.
We've managed to take a dump at it's peak;
To Reproduce
We haven't been able to reproduce this outside of our production server environments.
Is there a way we can determine what is causing this high memory usage during startup?
Edit
I've also been able to reproduce this with;