Integrate per-frame profiler into viewer.cpp#1015
Integrate per-frame profiler into viewer.cpp#1015vauduong merged 12 commits intofacebookresearch:masterfrom
Conversation
|
You need to run clang-format on your input. |
| // included) | ||
|
|
||
| //Profiling | ||
| Mn::DebugTools::GLFrameProfiler _profiler{ |
There was a problem hiding this comment.
| Mn::DebugTools::GLFrameProfiler _profiler{ | |
| Mn::DebugTools::GLFrameProfiler profiler_{ |
We use postfix _ to denote member variables
Thanks for the comments, ran clang-format! Will work on fixing functionality |
 mosra
left a comment
mosra
left a comment
There was a problem hiding this comment.
I tend to have huge reviews, sorry about that, haha :)
| Mn::DebugTools::GLFrameProfiler::Value::CpuDuration | | ||
| Mn::DebugTools::GLFrameProfiler::Value::GpuDuration | | ||
| Mn::DebugTools::GLFrameProfiler::Value::VertexFetchRatio | | ||
| Mn::DebugTools::GLFrameProfiler::Value::PrimitiveClipRatio, |
There was a problem hiding this comment.
Some of these are not present on GLES/WebGL and some won't work on Mac either because it has only GL 4.1 (see documentation of each value). You can use #ifndef MAGNUM_TARGET_GLES to disable those for webgl, for Mac (and other platforms w/o GL 4.6, such as various VMs) the best is checking if the relevant extension is present. For example
Mn::DebugTools::GLFrameProfiler::Values values =
      Mn::DebugTools::GLFrameProfiler::Value::FrameTime |
      Mn::DebugTools::GLFrameProfiler::Value::CpuDuration |
      Mn::DebugTools::GLFrameProfiler::Value::GpuDuration;
#ifndef MAGNUM_TARGET_GLES
if(Mn::GL::Context::current().isExtensionSupported<Mn::GL::Extensions::ARB::pipeline_statistics_query>()) {
  values |=
          Mn::DebugTools::GLFrameProfiler::Value::VertexFetchRatio |
          Mn::DebugTools::GLFrameProfiler::Value::PrimitiveClipRatio;
}
#endif
You may need to include <Magnum/GL/Context.h> and <Magnum/GL/Extensions.h> for this.
Or you can just not enable these two, but I think those are very valuable as they show how much should have been culled instead of being drawn and how optimized is the mesh.
There was a problem hiding this comment.
Thanks for showing me how to do this! I declared profileValues and profiler_ as private variables in the Viewer class definition, and then updated in Viewer::Viewer if needed (couldn't use if statements in class definition). I'm not familiar with best practices for declarations and constructors, so any feedback would be appreciated.
| redraw(); | ||
| /* Schedule a redraw only if profiling is enabled to avoid hogging the CPU */ | ||
| if (profiler_.isEnabled()) { | ||
| profiler_.printStatistics(10); |
There was a problem hiding this comment.
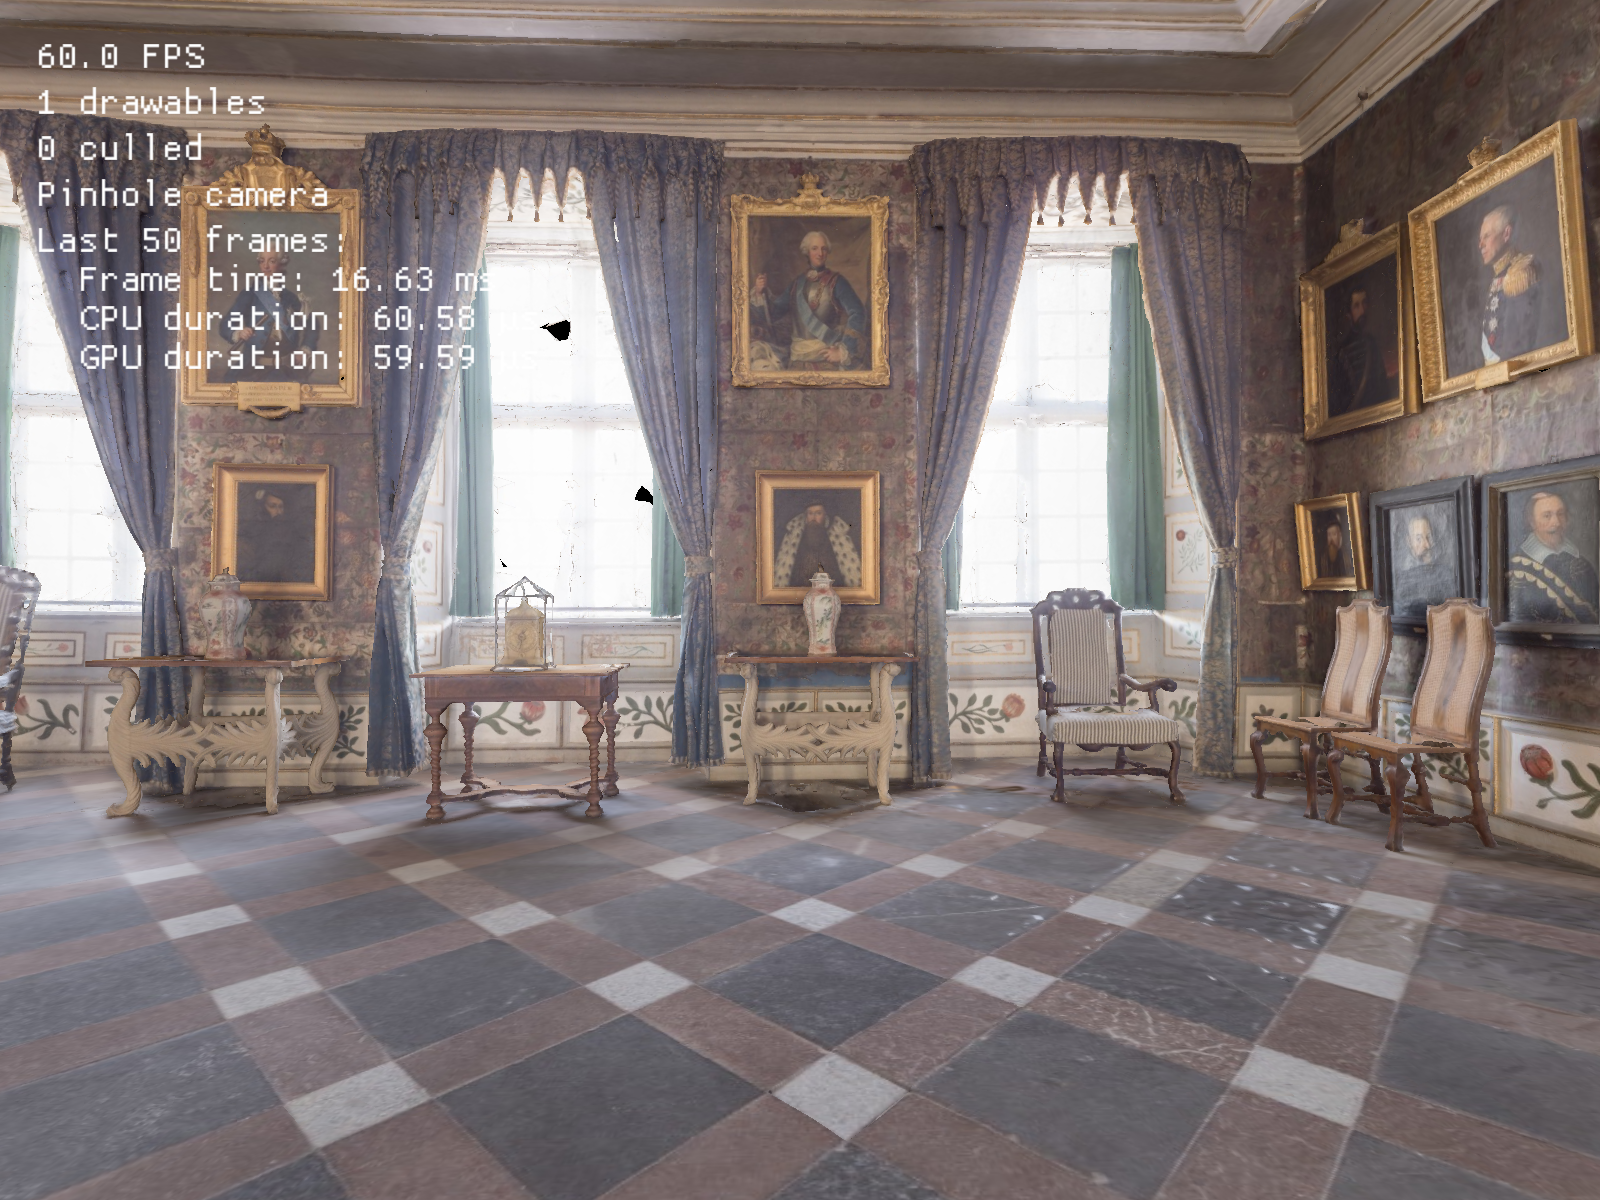
Since we have ImGui, it might maybe make sense to print the stats in the FPS overlay instead of in the console. Should be as simple as feeding profiler_.statistics() to ImGui::Text() among the others above.
Then you probably also don't need the , key binding anymore and it'll get toggled together with FPS. Or maybe the FPS isn't needed at all anymore with this? I admit I strongly prefer frame time over FPS, so this might need counteropinions from others (@bigbike, @aclegg3 ...) :)
There was a problem hiding this comment.
Thanks for all the helpful feedback @mosra! I ended up printing the stats to the fps overlay, and removing the "," key binding to toggle the profiler. In the most recent commit, the profiler is toggled with the fps overlay - happy to change this if anyone has preferences.
…r WebGL, print per frame profiler to imgui and toggle profiler with fps overlay
| Mn::DebugTools::GLFrameProfiler::Value::CpuDuration | | ||
| Mn::DebugTools::GLFrameProfiler::Value::GpuDuration; | ||
|
|
||
| Mn::DebugTools::GLFrameProfiler profiler_{profilerValues, 50}; |
There was a problem hiding this comment.
To avoid redundancy in the setup, you can also just default-construct the profiler_ here and move the profilerValues to the constructor.
|
|
||
| imgui_.newFrame(); | ||
|
|
||
| profiler_.beginFrame(); |
There was a problem hiding this comment.
Not sure if this was intentional, but what gets done / submitted to GL between beginFrame() / endFrame() adds up to the per-frame CPU and GPU duration in the output. As the code is now, only ImGui drawing is measured, which I'd say is the inverse of what we want :)
I'd say everything from the beginning of drawEvent() until after blitRgbaToDefault() (or maybe without the clears, without the blits, without the physics?) is of interest, the rest not really. Feel free to experiment and see which measurement scope gives the most useful results for datasets of various complexity.
(I have to admit the frame profiler is a bit lacking in the sense that it doesn't allow you to take multiple measurement points in a frame, only two. It could be worked around by having multiple profiler instances in a frame, for example dedicate one to measure just the cost of physics calculation by wrapping its begin/end around the physics step block. Just an idea, feel free to ignore that, you have a ton of other things to do and I don't want you to get stuck on this for weeks :))
There was a problem hiding this comment.
Thanks, that's fixed!
There was a problem hiding this comment.
@mosra:
Thank you for helping @vauduong . Sincerely appreciate your high quality review work!
I did not fully read the wiki about the profiler, can it be used as a stop-watch meaning it has functions such as pause() and resume() so that user can skip a piece of code in between (beginFrame() and endFrame()) when measuring the performance?
 bigbike
left a comment
bigbike
left a comment
There was a problem hiding this comment.
Looks good to me.
Please ship it!
Motivation and Context
We wish to integrate the FrameProfiler functionality which is present in magnum-player into the habitat simulator viewer.
How Has This Been Tested
Build and run, compare functionality to magnum-player profiling tool
Types of changes
Checklist