Auto mark: no display with non-zero reducer and bar mark #1340
Description
See examples. You get a bunch of zero-height bars:
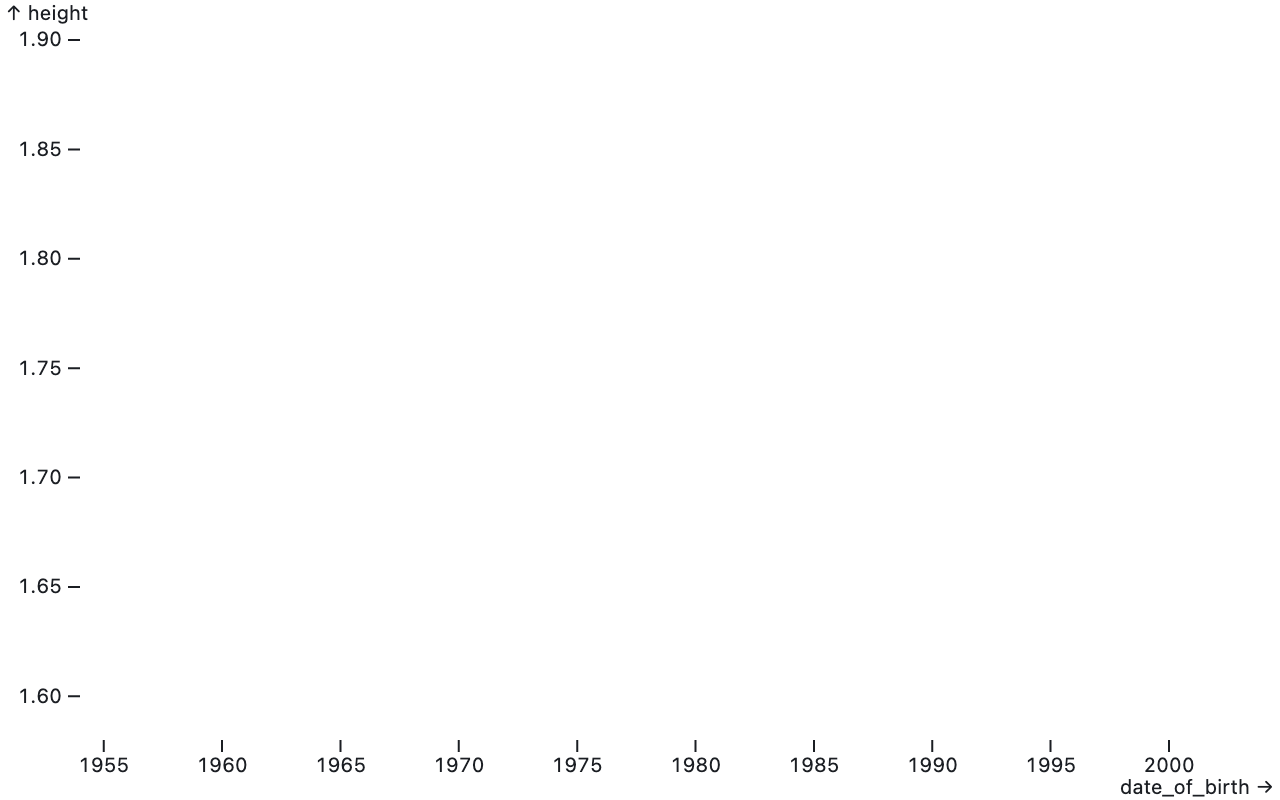
Plot.auto(olympians, {x: "date_of_birth", y: { value: "height", reduce: "mean" }, mark: "bar"}).plot()
The easy fix is to change the last row of this to use rectY instead of rect, on the theory that Plot.auto never has enough information to use Plot.rect effectively:
Lines 159 to 174 in c489290
That works in this case:

But it breaks the heatmap, because it gives it a zero baseline:
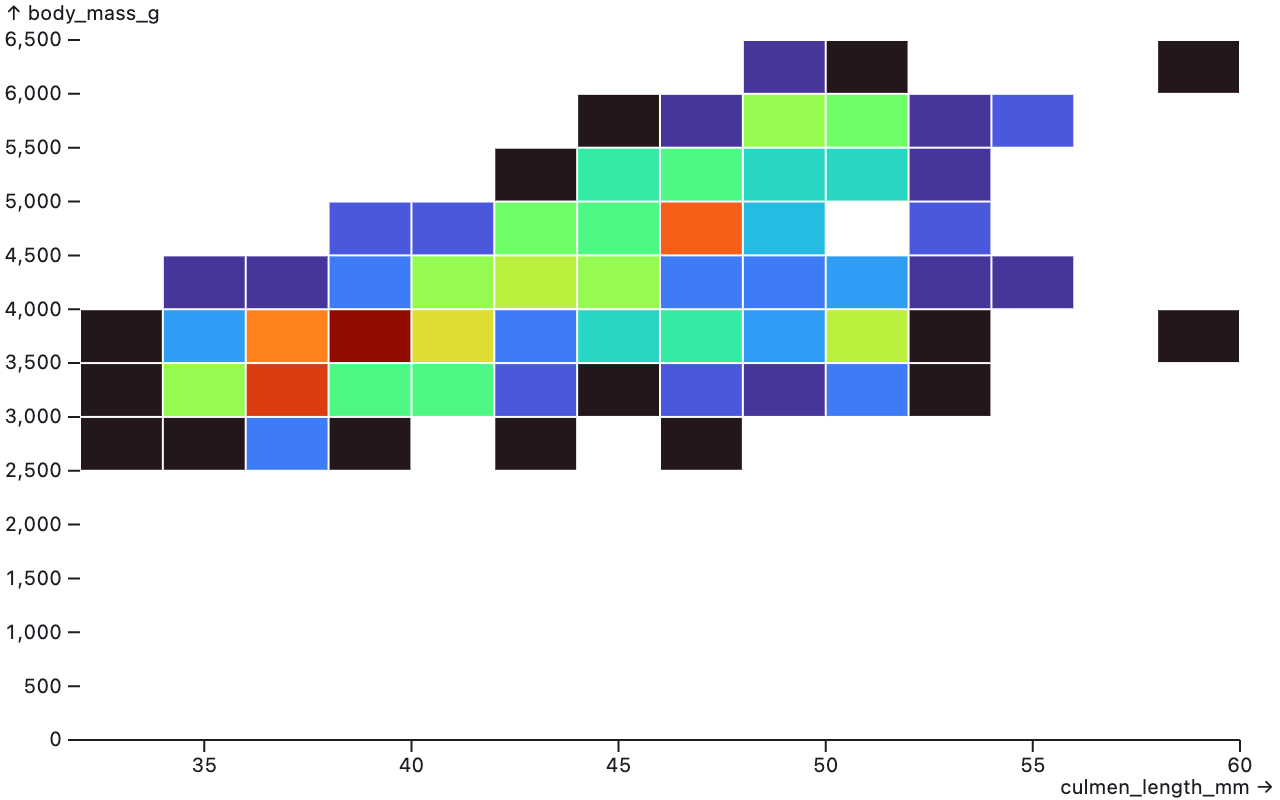
Plot.auto(penguins, {x: "culmen_length_mm", y: "body_mass_g", color: "count"}).plot()
Because we're inferring whether to show the zero baseline from the mark type:
Lines 217 to 220 in c489290
We could change that bit. But, moreover, the heatmap example shows that Plot.auto does sometimes have enough information to specify a rect mark: in the case of 2D binning. So just switching rect to rectY feels wrong.