Add normalize reducers min, max, deviation #603
Conversation
|
If you use the “deviation” basis, it means that you’re taking a set X = {x1, x2, x3, …} and mapping them to X′ = {x1 / d, x2 / d, x3 / d, …} where d = deviation(X). Is that what you expect? That seems surprising to me. I think that I would expect something more like {(x1 - m) / d, (x2 - m) / d, …} where m = median(X). |
There was a problem hiding this comment.
max is a nice addition (make it fit!), and min is symmetric for negative values. We might also want to normalize by extent (box all the values between min and max). (EDITED: we already have extent)
I can also see the use-case for deviation, in particular with a fixed domain of, say, [-3, 3]. Agree with @mbostock, that it should be centered, but I'd argue for centering around the mean not the median, per the std dev definition.
Re: variance, unless there is a real world use-case that I don't know of, I don't think it's a good idea: the variance is not in the same unit as the original data, but in unit squared, so the normalized value of data in meters would result in values expressed in m^-1, which I think is very confusing.
|
I agree with Fil’s recommendations. |
|
Thanks for the review! I made the following changes:
|
|
The |
 mbostock
left a comment
mbostock
left a comment
There was a problem hiding this comment.
Implementation looks good. 👍 Would you mind also updating the README, too?
src/transforms/normalize.js
Outdated
| const normalizeMedian = normalizeBasis((I, S) => median(I, i => S[i])); | ||
| const normalizeSum = normalizeBasis((I, S) => sum(I, i => S[i])); | ||
| const normalizeMin = normalizeBasis((I, S) => min(I, i => S[i])); | ||
| const normalizeSum = normalizeBasis((I, S) => sum(I, i => S[i])); |
There was a problem hiding this comment.
Please preserve the trailing newline at the end of this file. 🙏
There was a problem hiding this comment.
Updated (and preserved!). Let me know if you prefer a different phrasing or ordering (I left them as alphabetical, with extent and deviation at the end, as they follow a different pattern than those above)
README.md
Outdated
|
|
||
| The Plot.normalizeX and Plot.normalizeY transforms normalize series values relative to the given basis. For example, if the series values are [*y₀*, *y₁*, *y₂*, …] and the *first* basis is used, the mapped series values would be [*y₀* / *y₀*, *y₁* / *y₀*, *y₂* / *y₀*, …] as in an index chart. The **basis** option specifies how to normalize the series values. The following basis methods are supported: | ||
|
|
||
|
|
There was a problem hiding this comment.
Now there’s an extra newline. 😂
… all the points are equal, normalize to 0 instead of NaN.
01ea14f to
b3e4bf9
Compare
 Fil
left a comment
Fil
left a comment
There was a problem hiding this comment.
I think it's normal to crash on min if the minimum is 0 (the max normalization will also give NaNs if the max is zero.)
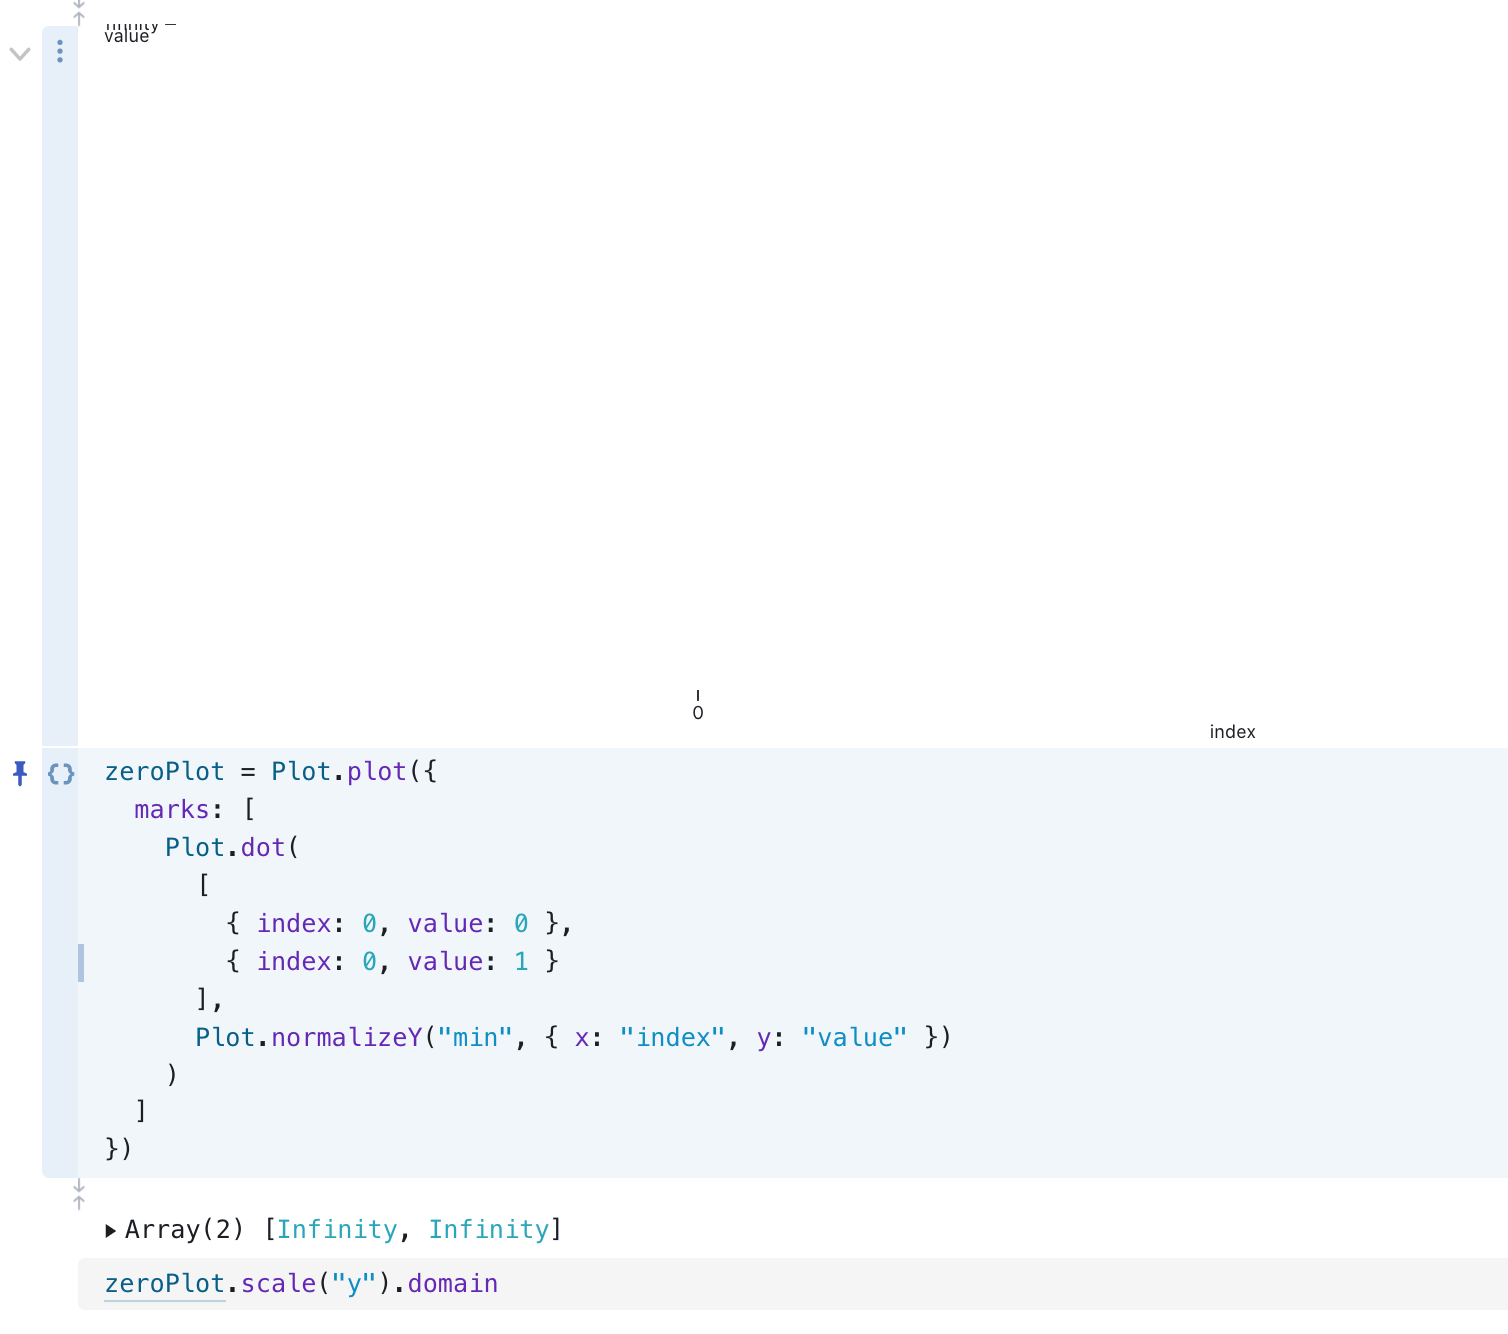
For deviation, we can avoid a crash since in that case, all values are equal, and it makes sense to normalize the value to 0 (it will happen, for example, on a facet for which there is only one data point: better to show it that not).
I've added a few unit tests, and have decorated your commits with your actual email (instead of [email protected]).
In your terminal, you can do:
$ git config --global user.name "John Doe"
$ git config --global user.email [email protected]
Added four more reducers that can be set as the
basisforPlot.normalize:varianceSee this notebook for a demo.