Repository navigation
Incorret timestamps of XMLHttpRequestInstrumentation spans after system sleep on browsers. #2705
Description

Hi, I use this sdks to trace browser requests.
"@opentelemetry/api": "^1.0.4",
"@opentelemetry/context-zone": "^1.0.1",
"@opentelemetry/exporter-jaeger": "^1.0.1",
"@opentelemetry/exporter-trace-otlp-http": "^0.27.0",
"@opentelemetry/instrumentation": "^0.27.0",
"@opentelemetry/instrumentation-document-load": "^0.27.0",
"@opentelemetry/instrumentation-fetch": "^0.27.0",
"@opentelemetry/instrumentation-xml-http-request": "^0.27.0",
"@opentelemetry/resources": "^1.0.1",
"@opentelemetry/sdk-trace-base": "^1.0.1",
"@opentelemetry/sdk-trace-web": "^1.0.1",registerInstrumentations({
instrumentations: [
new DocumentLoadInstrumentation(),
new FetchInstrumentation({
propagateTraceHeaderCorsUrls: /localhost/,
clearTimingResources: true
}),
new XMLHttpRequestInstrumentation({
ignoreUrls: [/\/login\/status$/],
clearTimingResources: true,
}),
],
});Everything works well on startup. But leaving the browser page there and let the computer sleep for one night, then the timestamps of every new spans will remain in yesterday.
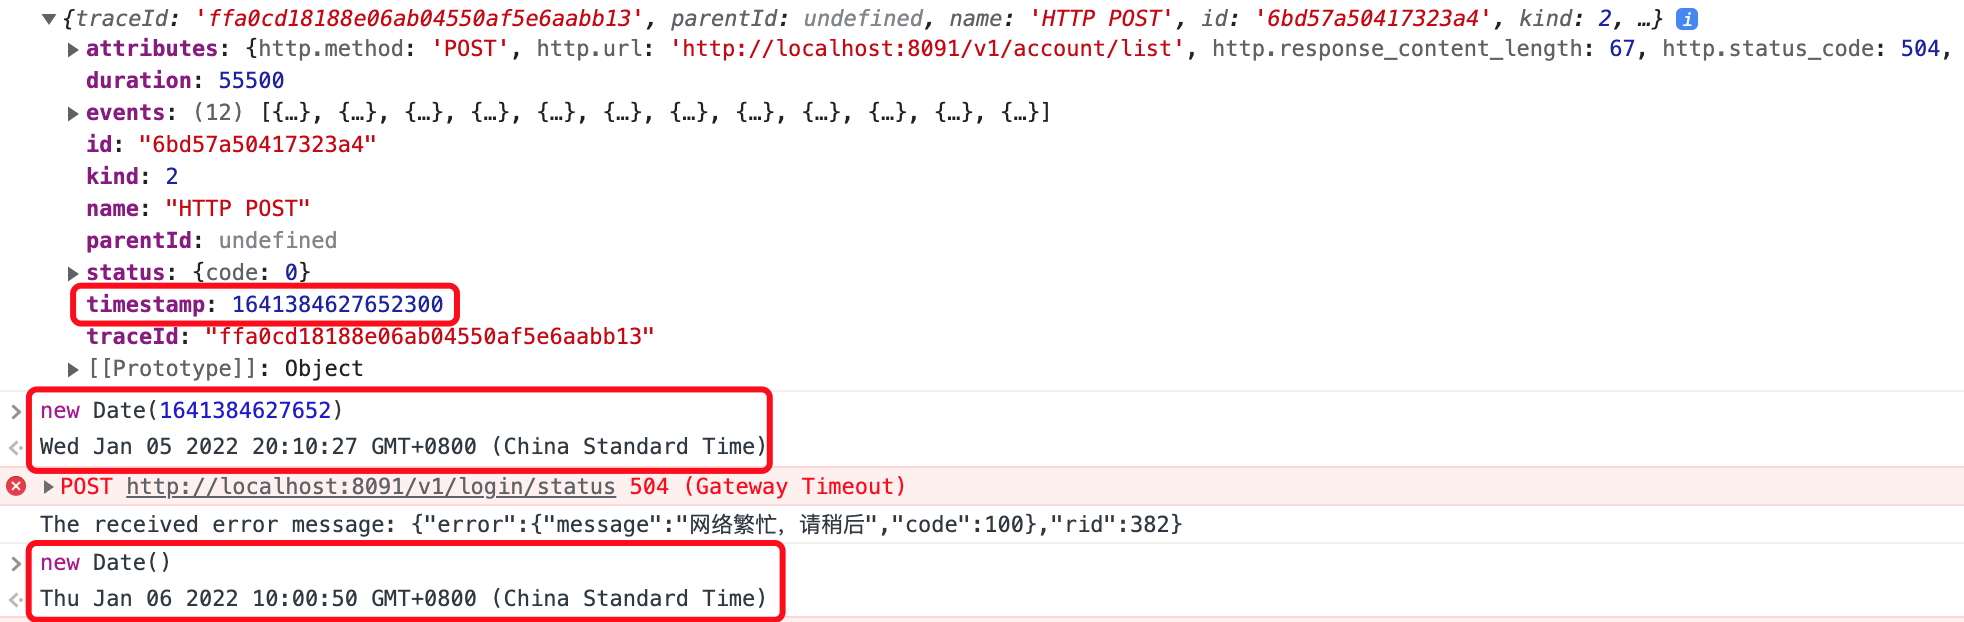
This bother me for several days and I found out that
if (currentSpan && spanUrl) {
  api.context.with(
    api.trace.setSpan(api.context.active(), currentSpan),
    () => {
      plugin._tasksCount++;
      xhrMem.sendStartTime = hrTime();
      currentSpan.addEvent(EventNames.METHOD_SEND);

      this.addEventListener('abort', onAbort);
      this.addEventListener('error', onError);
      this.addEventListener('load', onLoad);
      this.addEventListener('timeout', onTimeout);

      xhrMem.callbackToRemoveEvents = () => {
        unregister(this);
        if (xhrMem.createdResources) {
          xhrMem.createdResources.observer.disconnect();
        }
      };
      plugin._addHeaders(this, spanUrl);
      plugin._addResourceObserver(this, spanUrl);
    }
  );
}
@opentelemetry-instrumentation-xml-http-request fetches timestamp by calling hrTime() exported by opentelemetry-core
hrTime():
function getTimeOrigin(): number {
  let timeOrigin = performance.timeOrigin;
  if (typeof timeOrigin !== 'number') {
    const perf: TimeOriginLegacy = (performance as unknown) as TimeOriginLegacy;
    timeOrigin = perf.timing && perf.timing.fetchStart;
  }
  return timeOrigin;
}

/**
 * Returns an hrtime calculated via performance component.
 * @param performanceNow
 */
export function hrTime(performanceNow?: number): api.HrTime {
  const timeOrigin = numberToHrtime(getTimeOrigin());
  const now = numberToHrtime(
    typeof performanceNow === 'number' ? performanceNow : performance.now()
  );

  let seconds = timeOrigin[0] + now[0];
  let nanos = timeOrigin[1] + now[1];

  // Nanoseconds
  if (nanos > SECOND_TO_NANOSECONDS) {
    nanos -= SECOND_TO_NANOSECONDS;
    seconds += 1;
  }

  return [seconds, nanos];
}
but hrTime()'s implementation will be incorrect after system sleep. this happens on both Chrome or Firefox on MacOS, diff after one night sleep on my MacBook Pro:

Activity
dyladan commentedon Jan 6, 2022
This is something that has come up in the past. There have been attempts to fix it, but it isn't so easy. Using the performance clock is the only way to ensure that a clock is monotonic, an important property for our particular usecase. The system clock can drift and be updated during the lifetime of the process. Even if that happens, the performance clock will continue to return times as if the system clock was never changed until the process is restarted.
Previous attempts to fix this have used the performance clock to calculate span duration and the system clock to calculate span start time, but then you may have spans that start before their parent which causes all sorts of problems in tracing backends. Some tracing systems like jaeger attempt to deal with this by attempting time shift spans that appear to have incorrect times, but that time shift can fail in interesting and non-obvious ways sometimes.
vmarchaud commentedon Jan 8, 2022
Related: #852
dyladan commentedon Jan 27, 2022
Closing as a duplicate of #852