This package provides a comprehensive set of tools for higher-order spectral analysis in Python. It includes functions for estimating bicoherence, bispectrum, and various orders of cumulants.
You can install the toolkit using pip:
pip install higher-spectrumfrom spectrum import bicoherence, plot_bicoherence
bic, waxis = bicoherence(y, nfft=None, window=None, nsamp=None, overlap=None)
plot_bicoherence(bic, waxis)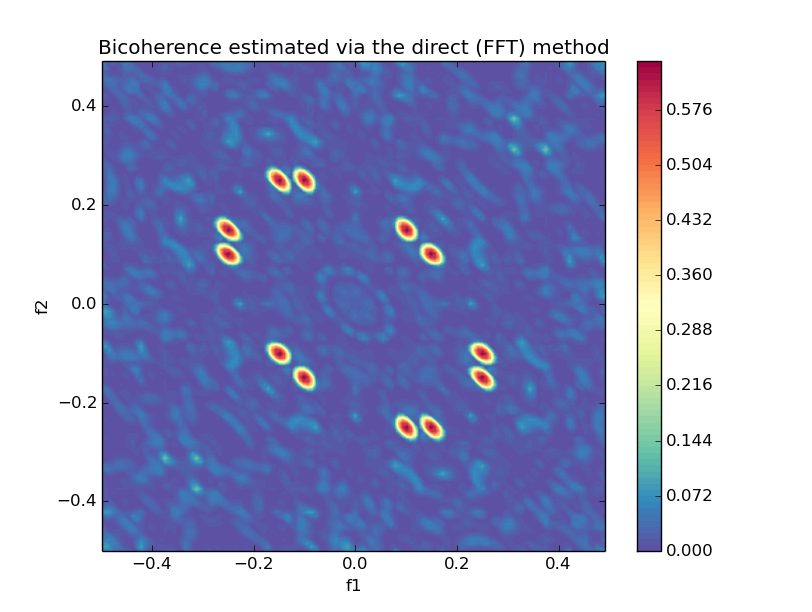
from spectrum import bicoherencex, plot_bicoherencex

bic, waxis = bicoherencex(w, x, y, nfft=None, window=None, nsamp=None, overlap=None)
plot_bicoherencex(bic, waxis)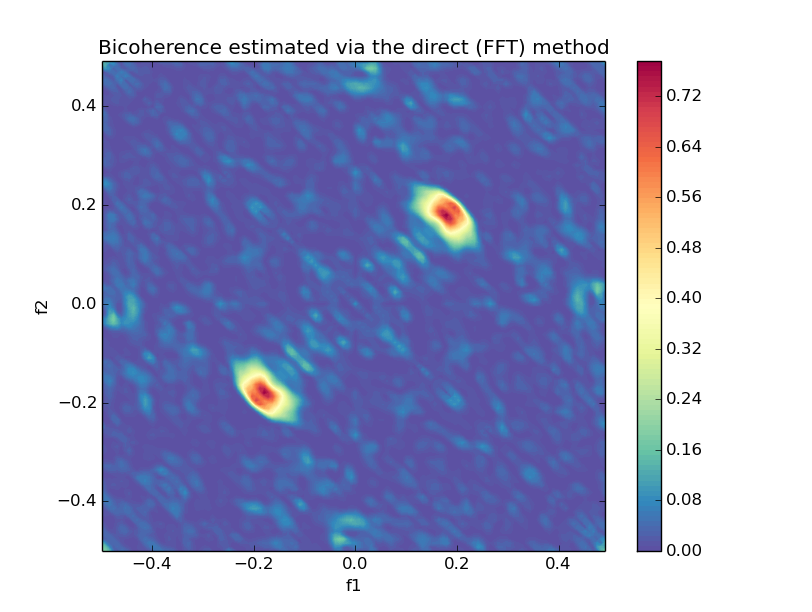
from spectrum import bispectrumd, plot_bispectrumd

Bspec, waxis = bispectrumd(y, nfft=None, window=None, nsamp=None, overlap=None)
plot_bispectrumd(Bspec, waxis)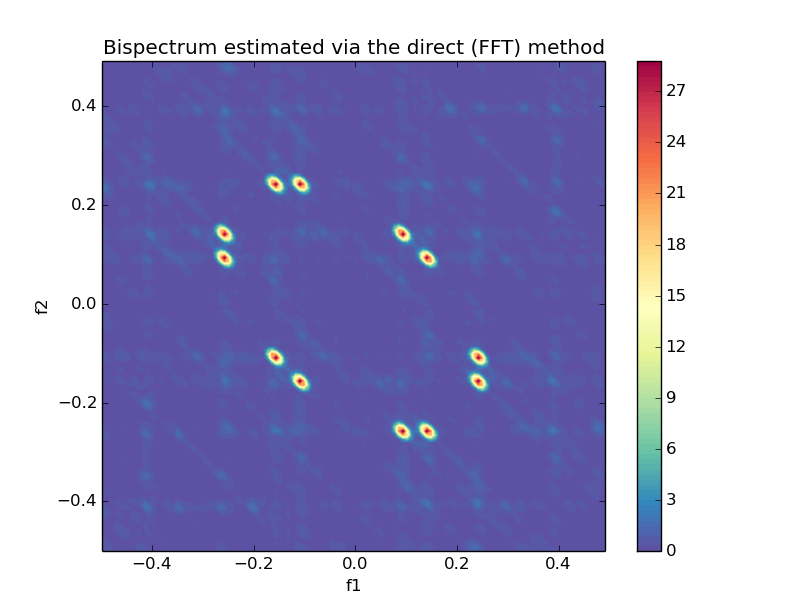
from spectrum import bispectrumi, plot_bispectrumi

Bspec, waxis = bispectrumi(y, nlag=None, nsamp=None, overlap=None, flag='biased', nfft=None, wind='parzen')
plot_bispectrumi(Bspec, waxis)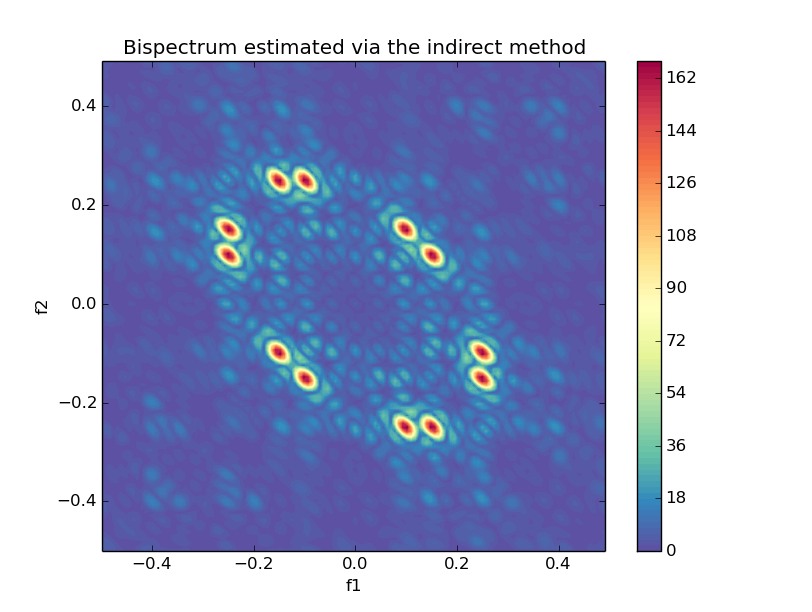
from spectrum import bispectrumdx, plot_bispectrumdx

Bspec, waxis = bispectrumdx(x, y, z, nfft=None, window=None, nsamp=None, overlap=None)
plot_bispectrumdx(Bspec, waxis)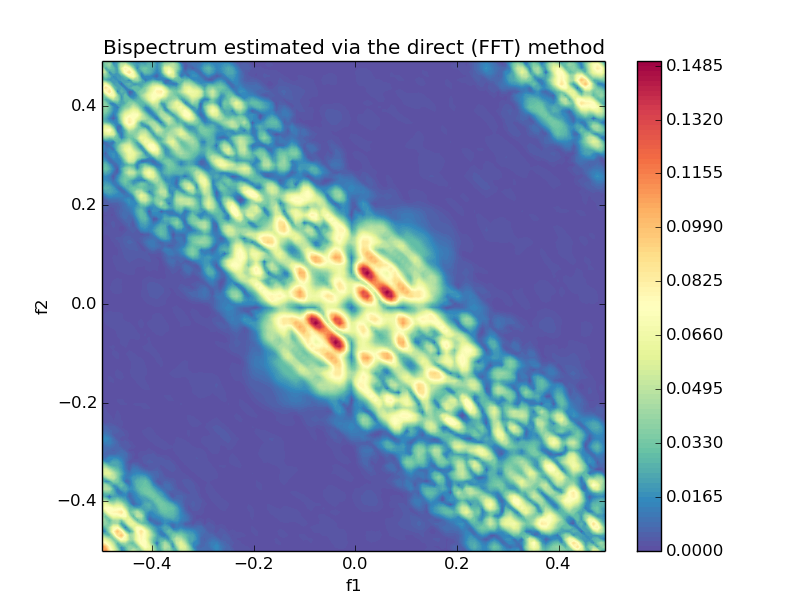
from spectrum import trispectrum, tricoherence, plot_trispectrum, plot_tricoherence_summary

# Trispectrum (4th order spectrum)
Tspec, waxis = trispectrum(y, nfft=None, window=None, nsamp=None, overlap=None)
plot_trispectrum(Tspec, waxis, slice_type='magnitude')

# Tricoherence (normalized trispectrum)
tricoh, waxis = tricoherence(y, nfft=None, window=None, nsamp=None, overlap=None)
plot_tricoherence_summary(tricoh, waxis)from spectrum import cumest
order = 2 # 2nd order
y_cum = cumest(y, norder=order, maxlag=20, nsamp=None, overlap=0, flag='biased', k1=0, k2=0)from spectrum import cum2x, cum3x, cum4x
# 2nd order cross-cumulant
ccov = cum2x(x, y, maxlag=20, nsamp=None, overlap=0, flag='biased')
# 3rd order cross-cumulant
c3 = cum3x(x, y, z, maxlag=20, nsamp=None, overlap=0, flag='biased', k1=0)
# 4th order cross-cumulant
c4 = cum4x(w, x, y, z, maxlag=20, nsamp=None, overlap=0, flag='biased', k1=0, k2=0)from spectrum import armafit, plot_arma_poles_zeros
# Estimate ARMA(p,q) parameters using cumulants
a, b, rho = armafit(y, p=2, q=1, maxlag=20)
plot_arma_poles_zeros(a, b, "ARMA Model Poles and Zeros")from spectrum import armasel, plot_ic_surface, plot_ic_comparison
# Select optimal ARMA order using information criteria
p_opt, q_opt, ic_min, ic_matrix = armasel(y, pmax=5, qmax=3, criterion='aic')
plot_ic_surface(ic_matrix, criterion='AIC')
plot_ic_comparison(y, pmax=5, qmax=3, criteria=['aic', 'bic', 'hq'])from spectrum import harmgen, harmgen_complex, plot_harmonic_signal
# Real harmonics with noise
y = harmgen(N=1000, A=[1.0, 0.5], f=[0.1, 0.2], phi=[0, np.pi/4],
sigma_n=0.1, sigma_m=0.05)
plot_harmonic_signal(y, fs=1.0, title="Harmonic Signal")
# Complex harmonics
y_complex = harmgen_complex(N=1000, A=1.0, f=0.1, sigma_n=0.1)from spectrum import nlgen, plot_nonlinear_series, nonlinear_measures
# Bilinear model
y_bilinear = nlgen(N=1000, model_type='bilinear', a=[0.5], b=[1.0], c=[0.1])
# Threshold autoregressive model
y_tar = nlgen(N=1000, model_type='tar', a=[0.6], threshold=0.0, a2=[0.3])
# Hénon map
y_henon = nlgen(N=1000, model_type='henon', a=[1.4], b=[0.3], sigma=0.01)
# Logistic map
y_logistic = nlgen(N=1000, model_type='logistic', a=[3.8], sigma=0.01)
# Plot and analyze
plot_nonlinear_series(y_henon, model_type="Hénon Map")
measures = nonlinear_measures(y_henon)- Bicoherence and cross-bicoherence estimation
- Direct and indirect methods for bispectrum estimation
- Cross-bispectrum estimation
- Trispectrum (4th order spectrum) estimation
- Tricoherence (normalized trispectrum) for quadratic coupling detection
- Cumulant estimation up to 4th order
- Cross-cumulant estimation up to 4th order
- Unified cumulant estimation interface
- ARMA parameter estimation using higher-order statistics
- Model order selection with AIC, BIC, and Hannan-Quinn criteria
- Robust estimation in colored Gaussian noise
- Harmonic signal generation with multiplicative and additive noise
- Complex harmonic generation
- Nonlinear time series generation (bilinear, TAR, Volterra, NARMA)
- Chaotic systems (Hénon map, logistic map)
- Comprehensive plotting functions for all methods
- Phase space reconstruction and analysis
- Nonlinearity measures and tests
- Information criterion surfaces for model selection
- Python 3.6+
- NumPy
- SciPy
- Matplotlib
This toolkit is based on the Higher Order Spectral Analysis toolkit for MATLAB. We've adapted and extended it for Python users.