-
Notifications
You must be signed in to change notification settings - Fork 1
feat: updated docs and README.md #61
New issue
Have a question about this project? Sign up for a free GitHub account to open an issue and contact its maintainers and the community.
By clicking “Sign up for GitHub”, you agree to our terms of service and privacy statement. We’ll occasionally send you account related emails.
Already on GitHub? Sign in to your account
Merged
Merged
Changes from all commits
Commits
File filter
Filter by extension
Conversations
Failed to load comments.
Loading
Jump to
Jump to file
Failed to load files.
Loading
Diff view
Diff view
There are no files selected for viewing
This file contains hidden or bidirectional Unicode text that may be interpreted or compiled differently than what appears below. To review, open the file in an editor that reveals hidden Unicode characters.
Learn more about bidirectional Unicode characters
| Original file line number | Diff line number | Diff line change |
|---|---|---|
| @@ -1,28 +1,148 @@ | ||
|  | ||
|  | ||
|
|
||
| # PyRetailScience | ||
|
|
||
| ⚡ Democratizing retail data analytics for all retailers ⚡ | ||
| ⚡ Rapid bespoke and deep dive retail analytics ⚡ | ||
|
|
||
| ## 🤔 What is PyRetailScience? | ||
|
|
||
| pyretailscience is a Python package designed for performing analytics on retail data. Additionally, the package includes functionality for generating test data to facilitate testing and development. | ||
| PyRetailScience equips you with a wide array of retail analytical capabilities, from segmentations to gain-loss analysis. Leave the mundane to us and elevate your role from data janitor to insights virtuoso. | ||
|
|
||
| ## Installation | ||
|
|
||
| To install pyretailscience, use the following pip command: | ||
| To get the latest release: | ||
|
|
||
| ```bash | ||
| pip install pyretailscience | ||
| ``` | ||
|
|
||
| ## Quick Start | ||
| Alternatively, if you want the very latest version of the package you can install it from GitHub: | ||
|
|
||
| ```bash | ||
| pip install git+https://github.com/Data-Simply/pyretailscience.git | ||
| ``` | ||
|
|
||
| ## Features | ||
|
|
||
| - **Tailored for Retail**: Leverage pre-built functions designed specifically for retail analytics. From customer segmentations to gains loss analysis, PyRetailScience provides over a dozen building blocks you need to tackle retail-specific challenges efficiently and effectively. | ||
|
|
||
|  | ||
|
|
||
| - **Reliable Results**: Built with extensive unit testing and best practices, PyRetailScience ensures the accuracy and reliability of your analyses. Confidently present your findings, knowing they're backed by a robust, well-tested framework. | ||
|
|
||
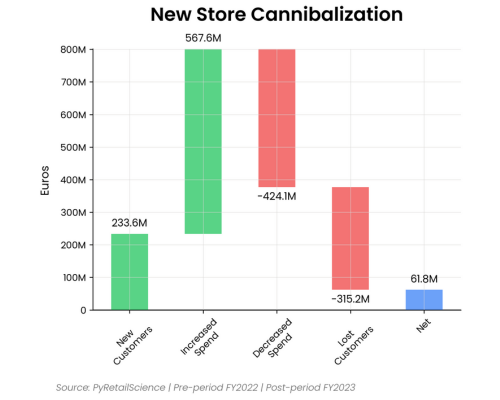
| - **Professional Charts**: Say goodbye to hours of tweaking chart styles. PyRetailScience delivers beautifully standardized visualizations that are presentation-ready with just a few lines of code. Impress stakeholders and save time with our pre-built, customizable chart templates. | ||
|
|
||
|  | ||
|
|
||
| - **Workflow Automation**: PyRetailScience streamlines your workflow by automating common retail analytics tasks. Easily loop analyses over different dimensions like product categories or countries, and seamlessly use the output of one analysis as input for another. Spend less time on data manipulation and more on generating valuable insights. | ||
|
|
||
| ## Examples | ||
|
|
||
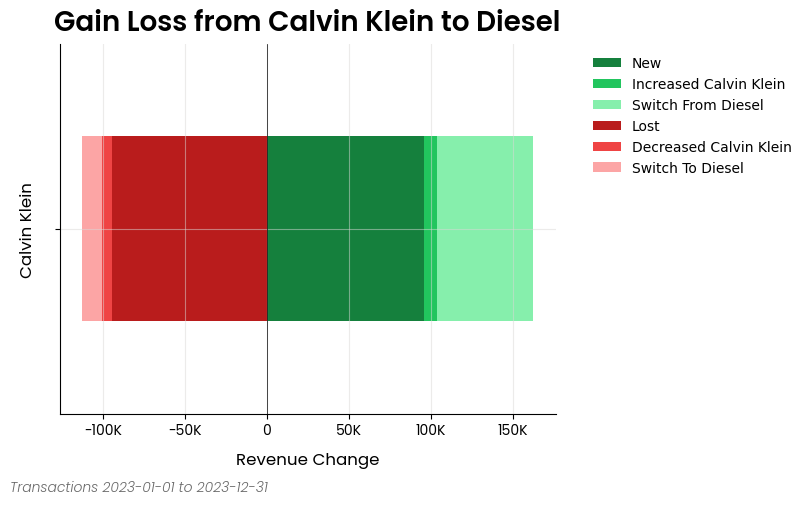
| ### Gains Loss Analysis | ||
|
|
||
| Here is an excerpt from the gain loss analysis example [notebook](https://pyretailscience.datasimply.co/examples/gain_loss/) | ||
|
|
||
| ```python | ||
| from pyretailscience.gain_loss import GainLoss | ||
|
|
||
| gl = GainLoss( | ||
| df, | ||
| # Flag the rows of period 1 | ||
| p1_index=time_period_1, | ||
| # Flag the rows of period 2 | ||
| p2_index=time_period_2, | ||
| # Flag which rows are part of the focus group. | ||
| # Namely, which rows are Calvin Klein sales | ||
| focus_group_index=df["brand_name"] == "Calvin Klein", | ||
| focus_group_name="Calvin Klein", | ||
| # Flag which rows are part of the comparison group. | ||
| # Namely, which rows are Diesel sales | ||
| comparison_group_index=df["brand_name"] == "Diesel", | ||
| comparison_group_name="Diesel", | ||
| # Finally we specifiy that we want to calculate | ||
| # the gain/loss in total revenue | ||
| value_col="total_price", | ||
| ) | ||
| # Ok now let's plot the result | ||
| gl.plot( | ||
| x_label="Revenue Change", | ||
| source_text="Transactions 2023-01-01 to 2023-12-31", | ||
| move_legend_outside=True, | ||
| ) | ||
| plt.show() | ||
| ``` | ||
|
|
||
|  | ||
|
|
||
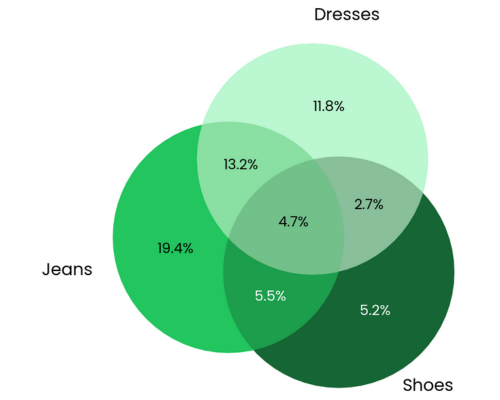
| ### Cross Shop Analysis | ||
|
|
||
| Here is an excerpt from the cross shop analysis example [notebook](https://pyretailscience.datasimply.co/examples/cross_shop/) | ||
|
|
||
| ```python | ||
| from pyretailscience import cross_shop | ||
|
|
||
| cs = cross_shop.CrossShop( | ||
| df, | ||
| group_1_idx=df["category_1_name"] == "Jeans", | ||
| group_2_idx=df["category_1_name"] == "Shoes", | ||
| group_3_idx=df["category_1_name"] == "Dresses", | ||
| labels=["Jeans", "Shoes", "Dresses"], | ||
| ) | ||
| cs.plot( | ||
| title="Jeans are a popular cross-shopping category with dresses", | ||
| source_text="Source: Transactions 2023-01-01 to 2023-12-31", | ||
| figsize=(6, 6), | ||
| ) | ||
| plt.show() | ||
| # Let's see which customers were in which groups | ||
| display(cs.cross_shop_df.head()) | ||
| # And the totals for all groups | ||
| display(cs.cross_shop_table_df) | ||
| ``` | ||
|
|
||
|  | ||
|
|
||
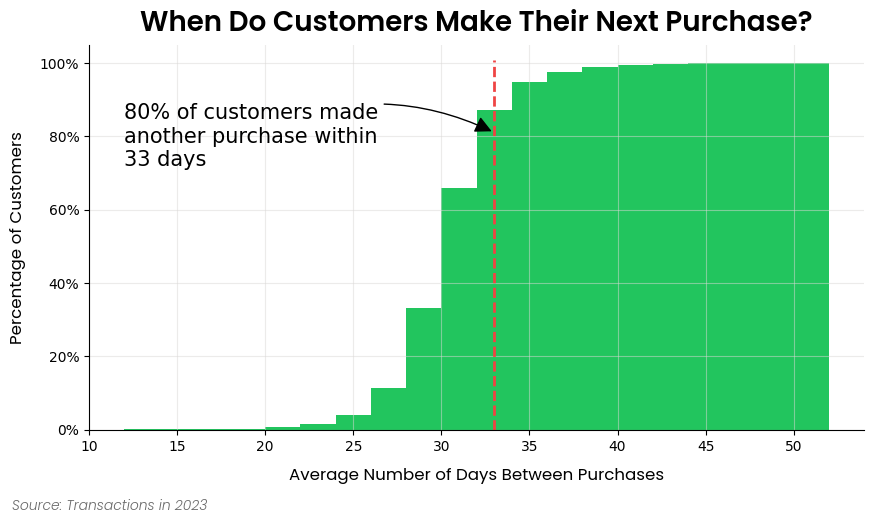
| ### Customer Retention Analysis | ||
|
|
||
| Here is an excerpt from the customer retention analysis example [notebook](https://pyretailscience.datasimply.co/examples/retention/) | ||
|
|
||
| ```python | ||
| ax = dbp.plot( | ||
| figsize=(10, 5), | ||
| bins=20, | ||
| cumlative=True, | ||
| draw_percentile_line=True, | ||
| percentile_line=0.8, | ||
| source_text="Source: Transactions in 2023", | ||
| title="When Do Customers Make Their Next Purchase?", | ||
| ) | ||
|
|
||
| # Let's dress up the chart a bit of text and get rid of the legend | ||
| churn_period = dbp.purchases_percentile(0.8) | ||
| ax.annotate( | ||
| f"80% of customers made\nanother purchase within\n{round(churn_period)} days", | ||
| xy=(churn_period, 0.81), | ||
| xytext=(dbp.purchase_dist_s.min(), 0.8), | ||
| fontsize=15, | ||
| ha="left", | ||
| va="center", | ||
| arrowprops=dict(facecolor="black", arrowstyle="-|>", connectionstyle="arc3,rad=-0.25", mutation_scale=25), | ||
| ) | ||
| ax.legend().set_visible(False) | ||
| plt.show() | ||
| ``` | ||
|
|
||
|  | ||
|
|
||
| ## Documentation | ||
|
|
||
| Coming Soon | ||
| Please see [here](https://pyretailscience.datasimply.co/) for full documentation, which includes: | ||
|
|
||
| # Contributing | ||
| - [Analysis Modules](https://pyretailscience.datasimply.co/analysis_modules/): Overview of the framework and the structure of the docs. | ||
| - [Examples](https://pyretailscience.datasimply.co/examples/retention/): If you're looking to build something specific or are more of a hands-on learner, check out our examples. This is the best place to get started. | ||
| - [API Reference](https://pyretailscience.datasimply.co/api/gain_loss/): Thorough documentation of every class and method. | ||
|
|
||
| We welcome contributions from the community to enhance and improve pyretailscience. To contribute, please follow these steps: | ||
| ## Contributing | ||
|
|
||
| We welcome contributions from the community to enhance and improve PyRetailScience. To contribute, please follow these steps: | ||
|
|
||
| 1. Fork the repository. | ||
| 2. Create a new branch for your feature or bug fix. | ||
|
|
@@ -32,6 +152,12 @@ We welcome contributions from the community to enhance and improve pyretailscien | |
|
|
||
| Please make sure to follow the existing coding style and provide unit tests for new features. | ||
|
|
||
| ## Contact / Support | ||
|
|
||
| This repository is supported by Data simply. | ||
|
|
||
| If you are interested in seeing what Data Simply can do for you, then please email [email protected]. We work with companies at a variety of scales and with varying levels of data and retail analytics sophistication, to help them build, scale or streamline their analysis capabilities. | ||
|
|
||
| ## Contributors | ||
|
|
||
| <a href="https://github.com/Data-Simply/pyretailscience/graphs/contributors"> | ||
|
|
@@ -40,6 +166,25 @@ Please make sure to follow the existing coding style and provide unit tests for | |
|
|
||
| Made with [contrib.rocks](https://contrib.rocks). | ||
|
|
||
| ## Acknowledgements | ||
|
|
||
| Built with expertise doing analytics and data science for scale-ups to multi-nationals, including: | ||
|
|
||
| - Loblaws | ||
| - Dominos | ||
| - Sainbury's | ||
| - IKI | ||
| - Migros | ||
| - Sephora | ||
| - Nectar | ||
| - Metro | ||
| - Coles | ||
| - GANNI | ||
| - Mindful Chef | ||
| - Auchan | ||
| - Attraction Tickets Direct | ||
| - Roman Originals | ||
|
|
||
| ## License | ||
|
|
||
| This project is licensed under the Elastic License 2.0 - see the [LICENSE](LICENSE) file for details. | ||
This file contains hidden or bidirectional Unicode text that may be interpreted or compiled differently than what appears below. To review, open the file in an editor that reveals hidden Unicode characters.
Learn more about bidirectional Unicode characters
| Original file line number | Diff line number | Diff line change |
|---|---|---|
| @@ -0,0 +1,3 @@ | ||
| # Cross Shop Analysis | ||
|
|
||
| ::: pyretailscience.cross_shop |
This file contains hidden or bidirectional Unicode text that may be interpreted or compiled differently than what appears below. To review, open the file in an editor that reveals hidden Unicode characters.
Learn more about bidirectional Unicode characters
| Original file line number | Diff line number | Diff line change |
|---|---|---|
| @@ -0,0 +1,3 @@ | ||
| # Customer Analysis | ||
|
|
||
| ::: pyretailscience.customer |
This file contains hidden or bidirectional Unicode text that may be interpreted or compiled differently than what appears below. To review, open the file in an editor that reveals hidden Unicode characters.
Learn more about bidirectional Unicode characters
| Original file line number | Diff line number | Diff line change |
|---|---|---|
| @@ -0,0 +1,3 @@ | ||
| # Gain Loss Analysis | ||
|
|
||
| ::: pyretailscience.gain_loss |
This file contains hidden or bidirectional Unicode text that may be interpreted or compiled differently than what appears below. To review, open the file in an editor that reveals hidden Unicode characters.
Learn more about bidirectional Unicode characters
| Original file line number | Diff line number | Diff line change |
|---|---|---|
| @@ -0,0 +1,3 @@ | ||
| # Range Planning | ||
|
|
||
| ::: pyretailscience.range_planning |
This file contains hidden or bidirectional Unicode text that may be interpreted or compiled differently than what appears below. To review, open the file in an editor that reveals hidden Unicode characters.
Learn more about bidirectional Unicode characters
| Original file line number | Diff line number | Diff line change |
|---|---|---|
| @@ -0,0 +1,3 @@ | ||
| # Segmentation | ||
|
|
||
| ::: pyretailscience.segmentation |
This file was deleted.
Oops, something went wrong.
This file contains hidden or bidirectional Unicode text that may be interpreted or compiled differently than what appears below. To review, open the file in an editor that reveals hidden Unicode characters.
Learn more about bidirectional Unicode characters
| Original file line number | Diff line number | Diff line change |
|---|---|---|
| @@ -0,0 +1,3 @@ | ||
| # Standard Graphs | ||
|
|
||
| ::: pyretailscience.standard_graphs |
This file contains hidden or bidirectional Unicode text that may be interpreted or compiled differently than what appears below. To review, open the file in an editor that reveals hidden Unicode characters.
Learn more about bidirectional Unicode characters
| Original file line number | Diff line number | Diff line change |
|---|---|---|
|
|
@@ -332,3 +332,7 @@ p { | |
| .md-header__title { | ||
| margin-left: 0px !important; | ||
| } | ||
|
|
||
| .md-source__repository { | ||
| font-size: 0.55rem; | ||
| } | ||
This file contains hidden or bidirectional Unicode text that may be interpreted or compiled differently than what appears below. To review, open the file in an editor that reveals hidden Unicode characters.
Learn more about bidirectional Unicode characters
Add this suggestion to a batch that can be applied as a single commit.
This suggestion is invalid because no changes were made to the code.
Suggestions cannot be applied while the pull request is closed.
Suggestions cannot be applied while viewing a subset of changes.
Only one suggestion per line can be applied in a batch.
Add this suggestion to a batch that can be applied as a single commit.
Applying suggestions on deleted lines is not supported.
You must change the existing code in this line in order to create a valid suggestion.
Outdated suggestions cannot be applied.
This suggestion has been applied or marked resolved.
Suggestions cannot be applied from pending reviews.
Suggestions cannot be applied on multi-line comments.
Suggestions cannot be applied while the pull request is queued to merge.
Suggestion cannot be applied right now. Please check back later.
There was a problem hiding this comment.
Choose a reason for hiding this comment
The reason will be displayed to describe this comment to others. Learn more.
Avoid using bare URLs.
Use markdown syntax to create a clickable link.
Committable suggestion
Tools
LanguageTool
Markdownlint