legends - 2 #583
legends - 2 #583
Conversation
Idea: Plot.legend({color: scale}) always takes a scale, with chart.legend("color", [legendOptions]) available as shorthand?
Is that a requirement of this new design? Or just something we haven’t implemented yet? |
|
I'd like to be allowed to pass any option for the legend in the scale definition. For example, I'd like to say: However since we control with an explicit include list the parameters that get out of chart.scale("color"), this means that chart.scale should know the exact list of parameters that are allowed — this is good in one sense (a strict output), but poor in terms of separation of concerns. It's not a blocker: we can write this list for the internally defined legends; and when a user designs a legend that takes in a new option, they can read it from the second argument to the legend("color", options) function. But it seems a bit inconsistent. |
3ef4932 to
729b4a2
Compare
|
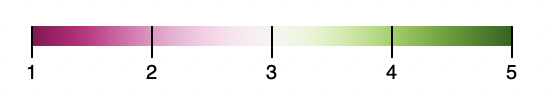
Looks like asymmetric diverging scales aren’t rendered correctly.
Plot.legend({
  color: {
    type: "diverging",
    symmetric: false,
    domain: [1, 4],
    pivot: 3,
    scheme: "PiYG"
  }
})
It seems to be caused by this, where color is already an “exposed” scale from an existing plot. Which suggests that calling exposeScale or Scale is not idempotent. 🤔 exposeScale(Scale("color", undefined, color))Ah, yes. It’s because the exposed scale drops the |
|
I’m also noticing that options on the color scale aren’t passed through to the legend in the plot.legend("color") case, which is because plot.scale("color") doesn’t return those options on the exposed scale. I’d guess that we should expose the axis/legend options on the exposed scale, though? Because if you’re sharing a scale across charts, I think you’d expect the legends to be the same, too, at least by default. |
|
It looks like sqrt transforms (and possibly others) aren’t rendered correctly: the sqrt transform should apply to the tick positions, not the interpolator, but it seems to be applying to both. For example, here’s a sqrt color scale:
Plot.plot({
  color: {
    domain: [0, 10],
    type: "sqrt"
  },
  marks: [
    Plot.cellX(d3.range(10))
  ]
})
Note that the value 2 is bright green. The legend for this suggests it should be orange:
Plot.plot({color: {type: "sqrt", domain: [0, 10]}}).legend("color") |


src/legends.js
Outdated
|
|
||
| export function legend({color, ...options}) { | ||
| if (color != null) { | ||
| return legendColor(exposeScale(Scale("color", undefined, color)), { |
There was a problem hiding this comment.
This will mutate color.type. 😬
9daf1fc to
e458581
Compare
There was a problem hiding this comment.
I made a few changes 😉 but this looks good to me now! To summarize:
- The legend implementations now take a scale descriptor (the internal representation), rather than the external representation returned by plot.scale(…). In the case where you call Plot.legend directly, the external representation is promoted to the internal one.
- When plot.legend(…) is used, the label, ticks, and tickFormat scale options are propagated to the legend.
- I made the legend styles consistent with Plot (adopting tabular-nums and system-ui), and adopted the same strategy of an embedded style element to allow inline styles to take precedence.
- I rewrote a good part of the legend code; mostly to take advantage of Plot’s stricter scale definitions and options, and to clean up the swatches implementation.
- I fixed the exposed representation of diverging scales to include symmetric: false so that the symmetric transform isn’t erroneously re-applied.
- I removed the “normalize the options” code in Plot. The normalized options weren’t used anywhere, and I want the non-normalized options available as legend options.
- I avoided the mutation of options.type in Scale.
- I cleaned up the internal representation of diverging scales (and niced scales) so that the domain is always available.
- I split the color legend tests into separate snapshots which made it easier for me to debug and review changes to the snapshots. Even just having names is helpful to describe what the test is trying to do (though comments are always welcome).
* opacity legend

* add color option

Co-authored-by: Mike Bostock <[email protected]>
|
YES |
Continuation of #539 ; build at https://observablehq.com/d/58e2c0596402e08f
In this PR the legends
are[EDIT: were initially] implemented aswhere mycolor is a plot or a plot scale obtained with plot.scale("color").
The same goes with {opacity:} or {r:}.
I tend to find this API less usable than the previous attempt, in the sense that:
UPDATE: they are now implemented as
The legends themselves have been adapted from d3's color-legend notebook (with the ramp or swatches); the opacity legend is a simple greyscale ramp; the radius legend is a bunch of based circles.
(It's also very possible that not every type of scale works—there will be a lot of variations to test.)
TODO:
- remove the scoped css from swatches?LATER
Fixes #23.